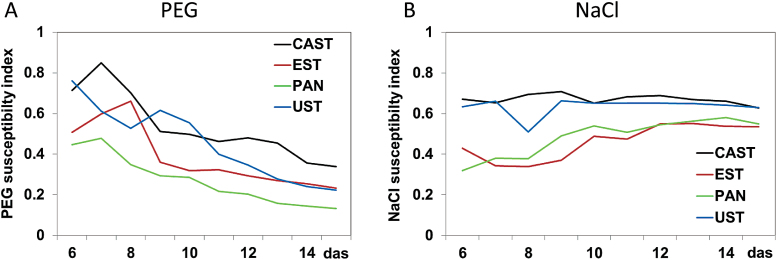
Fig. 6.
Tolerance indices for four lentil accessions and their growth responses to (A) osmotic stress (PEG) and (B) salt stress (NaCl). Plots represent the ratio of the mean plant height values as extracted from RGB side images per treatment, genotype, and day [6–15 days after sowing (das)] between stress conditions and the control. Tolerance index: 1=full tolerance, 0=total susceptibility. (This figure is available in colour at JXB online.)

