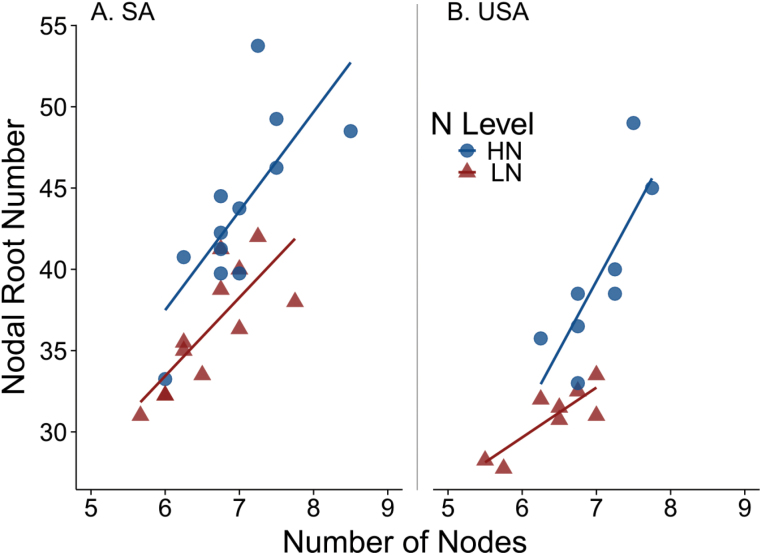
Fig. 3.
Scatter plots and linear regressions are shown for the relationship of the total number of nodes in a root crown with the total number of nodal roots in a root crown in both South Africa (SA, A) and the USA (B). Points are the mean of four replicates for each genotype. Data from high nitrogen (HN) are depicted with filled circles and in low nitrogen (LN) with filled triangles. Solid lines indicate the linear model of best fit for HN (y=6.09x+0.92; P=0.0066) and LN (y=4.82x+4.49; P=0.00266) in SA. Solid lines indicate the linear model of best fit for HN (y=8.44x–19.83; P=0.0177) and LN (y=3.07x+11.26; P=0.0082) in the USA. (This figure is available in colour at JXB online.)

