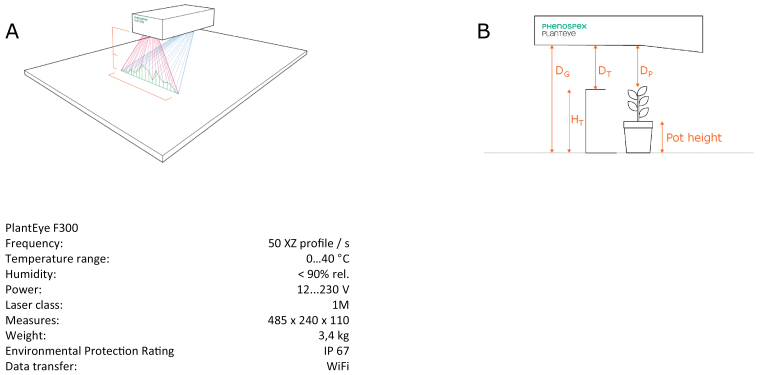
Fig. 1.
Schema of the scanning unit (PlantEyeR). (A) How the 3D object (canopy; green) is reconstructed from the set of 2D images (50–80 images per second) of the reflection (red) of laser line (green) projected on canopy. (B) The distances (to the ground, DG, to the barcode target, DT, and to the plant, DP) that are used in the computation. TH represents the target height and is used as a reference height for calculations. Pot height is set for the scanners and represents the height below which the data from the 3D data clouds are not used in the calculations.

