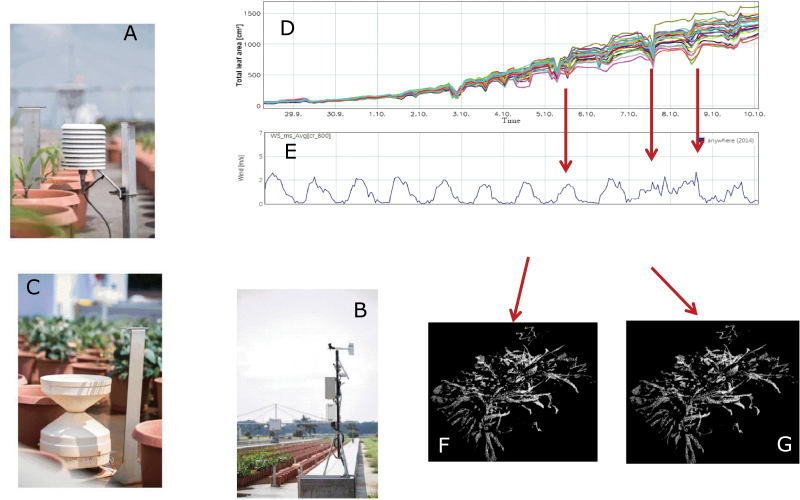
Fig. 3.
(A–C) Set of environmental sensors: (A) temperature, relative humidity, (B) solar radiation, wind speed, (C) rainfall. (D) Information on plant parameters in time visualized through web-based software interface (HortcontrolR). Environmental data visualized in Hortcontrol, e.g. (E) wind. (F, G) 3D-point clouds accessed from Hortcontrol, at the LeasyScan platform. The HortcontrolR allows the basic data operations and quality control (e.g. data obtained during the windy part of the day (F) are of less quality compared to data obtained during windless part of the day (G) and are filtered for further analysis.

