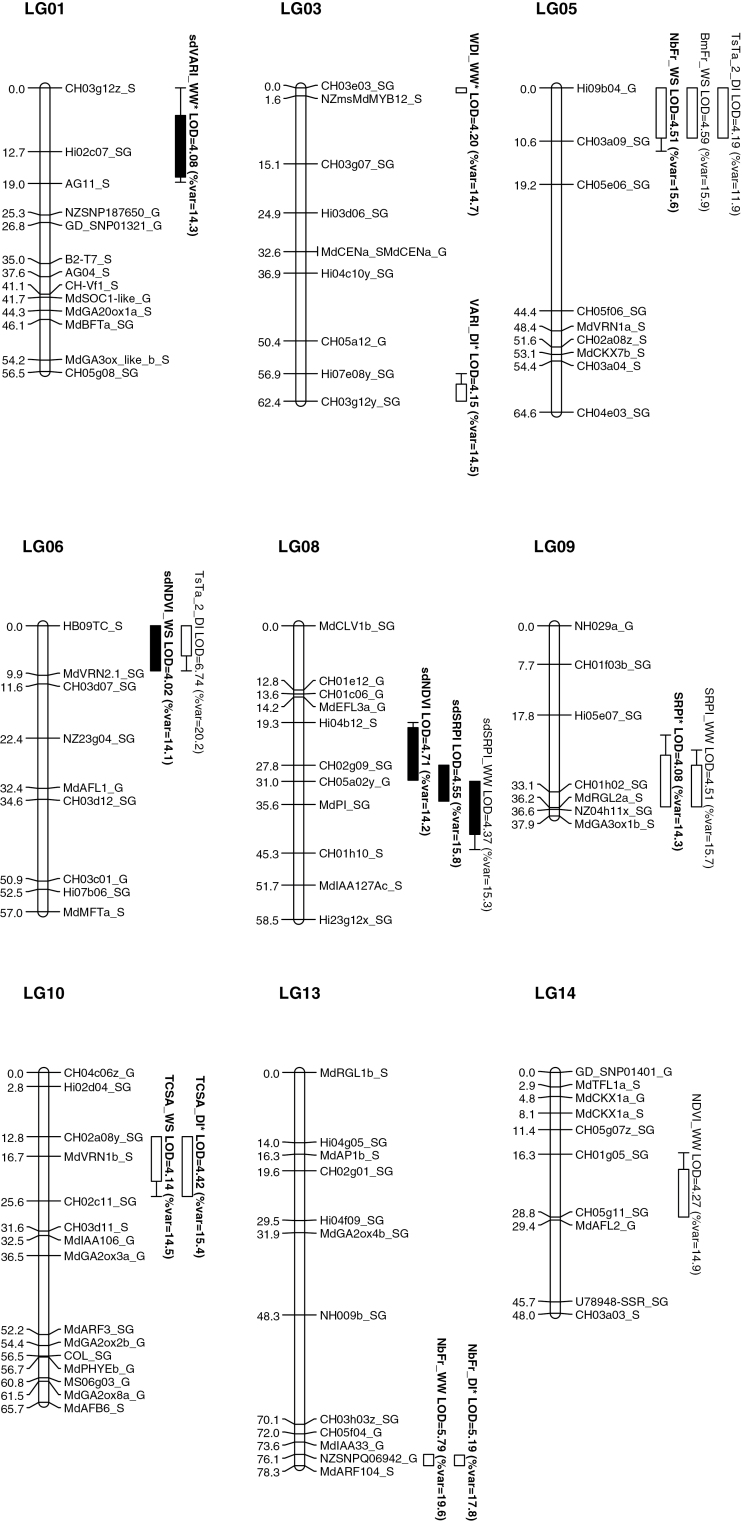
Fig. 1.
Genomic positions of the QTLs detected on the consensus ‘Starkrimson’×’Granny Smith’ (STK×GS) map. QTLs are represented by boxes, in which length represents the LOD-1 confidence interval and extended lines represent the LOD-2 confidence interval. Boxes relative to QTLs for mean values of variables are in white, and those relative to QTLs for standard deviations SD are in black. QTL detected for G-Blups are in bold type and * stand for QTLs detected for G-Blups and G-means.

