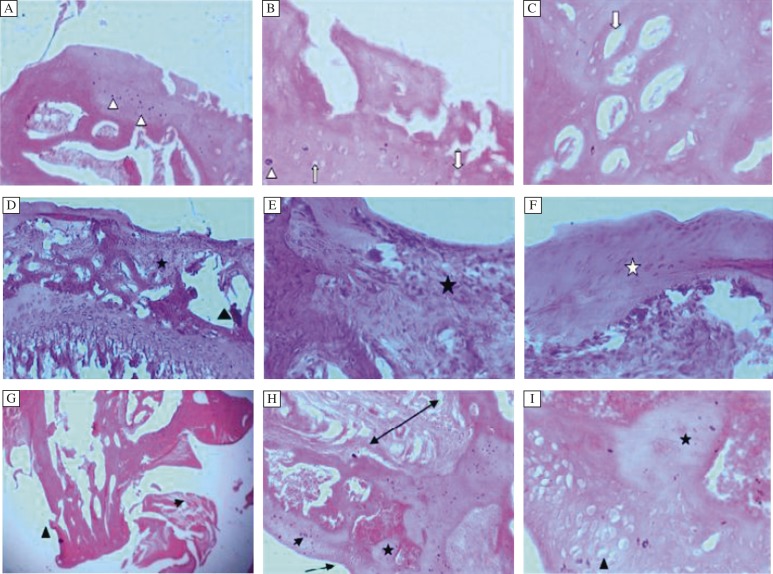
Fig. 2A, Progression of disease (OA) after IA injection.
A and B: Femorotibial joint 2 weeks post IA injection. The articular surface exhibits multifocal denuded cartilage with fissures extending deep into the mid zone. Large numbers of necrotic chondrocytes are seen (White arrow head). C: Chondrocytes degeneration exhibited by empty chondrons in the surface cartilage (White arrow); (Grade 3-3.5, Stage 3). H&E, A x100, B,C x400. D and E: Femoral condyle 4 weeks post IA injection showing marked loss of cartilage from the surface associated with subchondral bone collapse and fragmentation. Large areas of subchondral hemopoietic tissue are replaced by fibrous tissue (*). Marked bony trabeculae loss and collapse leading to formation of large interosseous spaces (black triangle) are seen. F: Irregular margin of the surface cartilage is visualized as well as irregular margin of the matrix of the regenerative fibrocartilage. (White asterisk), (Grade 4-4.5, Stage 3). H & E. D x100.E,F x400. 2G-Tibial condyle 8 weeks post IA injection showing extensive degeneration of the articular cartilage and the subchondral bone (arrow head) H and I: Complete loss of the cartilage and large cysts within the subchondral region (*). Articular cartilage erosion (arrow). Cortical area show fibrous tissue formation (double arrow). Associated large number of degenerative (necrotic) chondrocytes (arrow head). Regeneration of chondrocytes cell nest dispersed without normal arrangement (triangle). Subchondral cyst due to cartilage cell proiferation within the subchodral bone (*), (Garde 5-5.5, Stage 4). H & E.x20, x100, x400.

