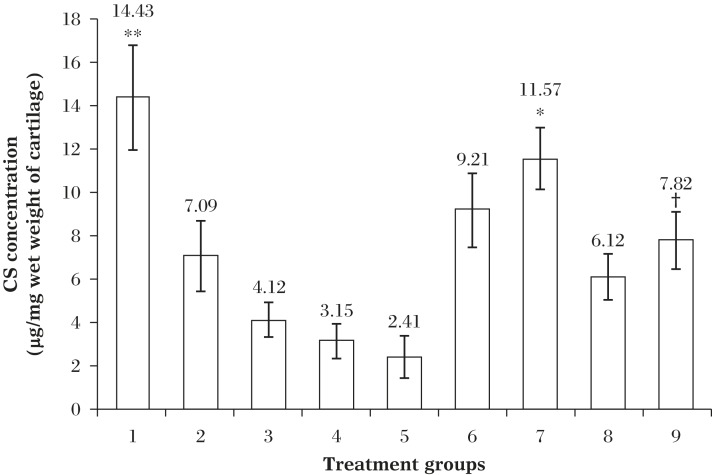
Fig. 5. Concentrations of CS in the articular cartilage of the treatment groups.
All values are reported as Mean±SD (n = 4; ANOVA), *P≤0.01 compared to Group 2 (arthritic control; post 7th day IA injection); †P≤0.05 compared to Group 3 (arthritic control; post 14th day IA injection); **P≤0.001 compared to all other group except Group 7.

