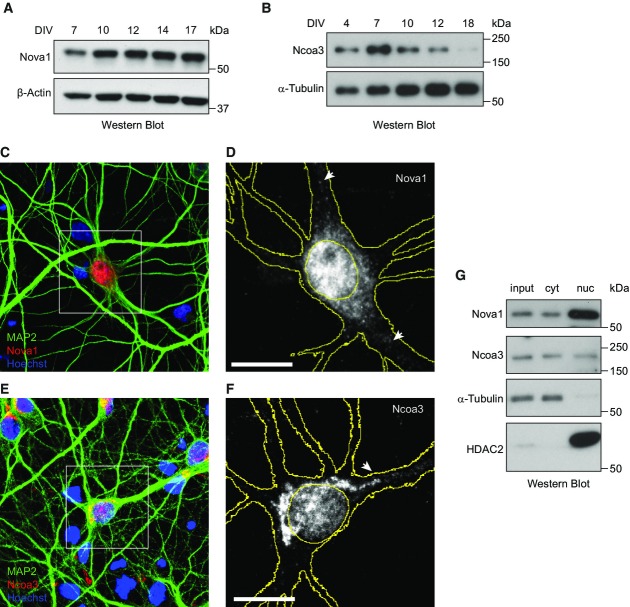
Figure 2.
Nova1 and Ncoa3 are expressed in developing rat hippocampal neurons in culture
- A, B Western blot analysis of Nova1 (A) and Ncoa3 (B) proteins using whole-cell extracts harvested from FUDR-treated (B) or non-treated (A) rat hippocampal neurons at the indicated days of in vitro (DIV) culture. α-tubulin or β-actin was used as a loading control.
- C–F Immunocytochemistry analysis of Nova1 (C, D) and Ncoa3 (E, F) expression (red) in hippocampal neuron cultures at 14 DIV. MAP2 staining (green) was used to visualize neurons and Hoechst staining (blue) to visualize nuclei. (D, F) Magnification of insert depicted in (C) or (E), respectively. For simplicity, only the Nova1 (D) or Ncoa3 (F) signal is shown in grayscale. Cell and nuclear outlines derived from MAP2 and Hoechst staining, respectively, are shown in yellow. Scale bar = 10 μm.
- G Western blot analysis of Nova1 and Ncoa3 using whole-cell lysates (input), cytoplasmic (cyt) or nuclear (nuc) fractions from FUDR-treated rat hippocampal neurons at seven DIV. α-tubulin was used as a cytoplasmic and HDAC2 as a nuclear marker protein.
Source data are available online for this figure.

