Figure 6.

Ncoa3 regulates dendritic complexity in rat hippocampal neurons
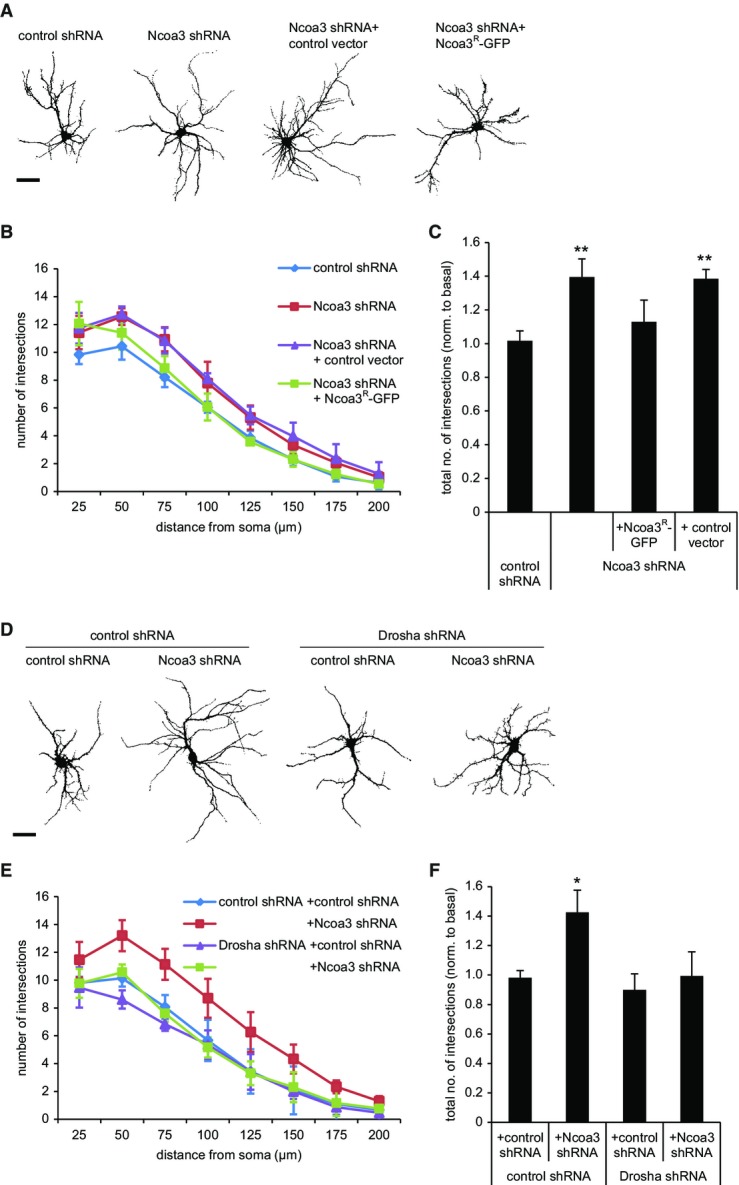
- A Representative traces of rat hippocampal pyramidal neurons (12 DIV) that had been transfected with GFP and the indicated shRNA or expression vectors at six DIV. Ncoa3R: Noca3-shRNA resistant. Scale bar = 50 μm.
- B Sholl analysis of hippocampal neurons from (A). The average number of intersections with concentric circles drawn around the cell soma at distances from 25 to 200 μm is shown. Values are the average ± standard deviation from three independent experiments (in each 10–12 cells per condition).
- C Sholl analysis as in (B), except that the total number of intersections was calculated for each condition. Values were normalized to a basal condition without shRNA. Data is the average ± standard deviation of three independent experiments. One-way ANOVA: P = 0.0029, Tukey’s HSD test: **P < 0.01 (to control shRNA condition).
- D Representative traces of rat hippocampal pyramidal neurons (12 DIV) that had been transfected with GFP and the indicated shRNA vectors. Scale bar = 50 μm.
- E, F Results from Sholl analysis performed as in (B, C). Data is the average ± standard deviation of four independent experiments. One-way ANOVA: P = 0.0037; Tukey’s HSD test: *P < 0.05 (to control shRNA condition).
