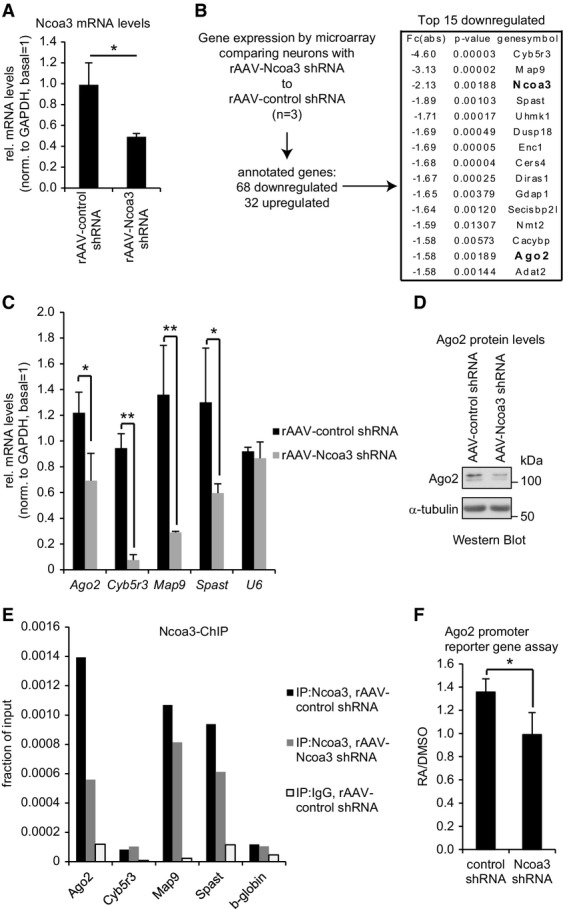
Figure 8.

Microarray analysis identifies Ago2 as an Ncoa3-regulated transcript
- qPCR analysis of Ncoa3 mRNA levels in hippocampal neurons (14 DIV) that had been infected with the indicated rAAV-expressed shRNAs at four DIV. The ratio of average Ncoa3 levels compared to the internal GAPDH control is shown after normalization to a non-infected basal condition. Data is the average ± standard deviation of three independent experiments. *P < 0.05 (unpaired t-test).
- Flow chart for the identification of Ncoa3-regulated genes by microarray in hippocampal neurons treated as in (A). Absolute fold changes (Fc(abs)), P-values (t-test), and corresponding gene symbols are given on the right for the top 15 downregulated transcripts. Ncoa3 and Ago2 are highlighted in bold.
- qPCR analysis of indicated Ncoa3-regulated transcripts in hippocampal neurons treated as in (A). The ratio of average candidate mRNA levels compared to the internal GAPDH mRNA control is shown after normalization to a non-infected basal condition. U6 was used as a negative control. Data is the average ± standard deviation of three independent experiments. *P < 0.05, **P < 0.01 (unpaired t-test).
- Western blot analysis of Ago2 protein in whole-cell extracts from hippocampal neurons treated as in (A). α-tubulin was used as a loading control.
- qPCR analysis of indicated Ncoa3-regulated genes from a representative Ncoa3-ChIP experiment performed in either control shRNA (black) or Ncoa3 shRNA (gray) infected neurons. As a specificity control, ChIP with an unrelated IgG was performed in control shRNA-transfected neurons (white). Values are presented as fraction of the respective input DNA used for ChIP.
- Average luciferase activity in retinoic acid (RA)- or mock (DMSO)-treated neurons transfected with an Ago2 promoter reporter gene together with the indicated shRNA constructs. Values are presented as the ratio from RA- to DMSO-treated neurons and represent the average ± standard deviation from three independent experiments. *P < 0.05 (unpaired t-test).
