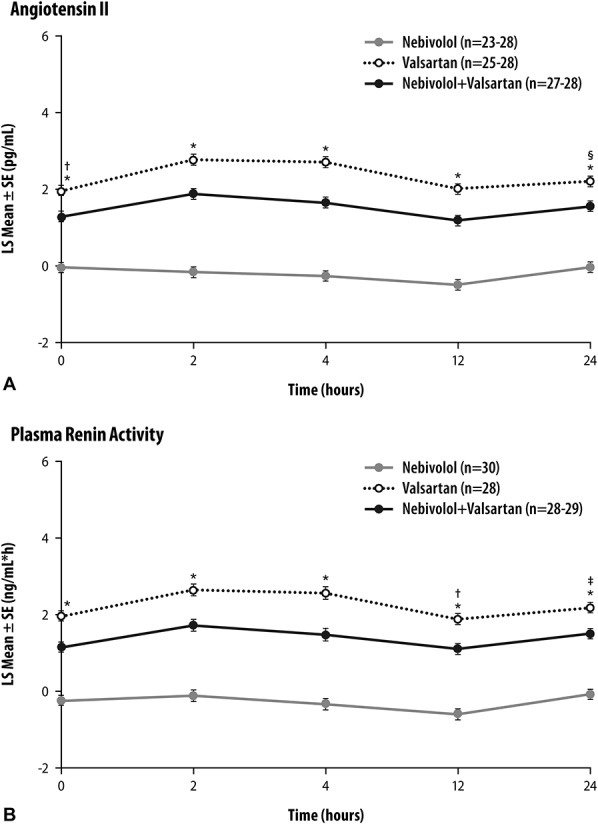
FIGURE 2.

Plasma angiotensin II concentration (A) and plasma renin activity (B) at the end of treatment periods (days 7, 20, and 33). *P < 0.0001, nebivolol versus combination and valsartan versus combination; †P = 0.0002, ‡P = 0.0003, §P = 0.0004, valsartan versus combination. SE, standard error of the mean.
