Figure 4.
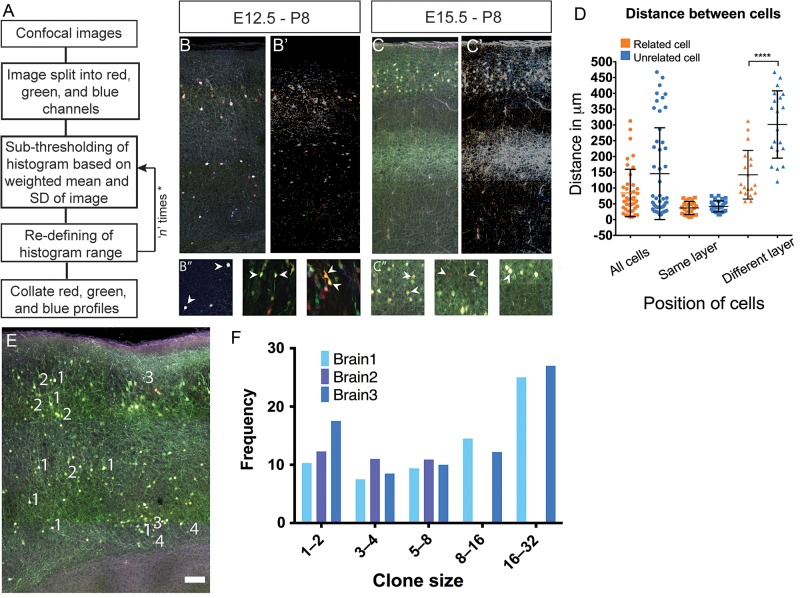
Analysis of the laminar and areal distribution of neurons derived from individual Tbr2+ intermediate progenitors in the Tbr2Cre mouse with stable transfection of fluoroproteins. (A) Algorithm for histogram based image clustering and segmentation. This algorithm was used to identify fluorescent cells that showed similar RGB properties and could be said to be clonal in origin. (B,C) Example of E12.5 (B) and E15.5 (C) electroporated brain labelled using CLoNe used for thresholding and the resulting thresholded image (B′,C′). Fluorescent cells of various hues can be seen in different layers. (B″,C″) Examples of clonally related cells identified using the algorithm. (D) Graph representing distance measured between clonally related and unrelated cells in same layer (36.8 ± 20.54 μm vs. 41.8 ± 17.30 μm), different layers (142.1 ± 76.8 μm vs. 294.9 ± 105.4 μm) and total (84.4 μm vs. 145.64 μm). Only cells clustered in different layers show significant difference as compared with unrelated cells (P < 0.0001, Mann–Whitney test). (E) Example of a 150 μm SeeDB clarified tissue section imaged under 4 channels and used for analysis. Numbers (in white) indicate clonal groups (1–4). Distribution of clonal group (1) is the most widespread radially, whereas 2 and 3 align in more radial fashion. Scale bar: 100 μm. (F) Graphical representation of clonal sizes and their frequency of occurrence. Clonal groups of 8–16 were found more frequently than those between 1 and 8. Also frequencies of larger clonal groups of 16–32 was the highest in the data analyzed from 3 brains electroporated at E12.5 and collected at P8. 3 serial sections each of 100–150 μm were studied and atleast 200 cells were studied in each section.

