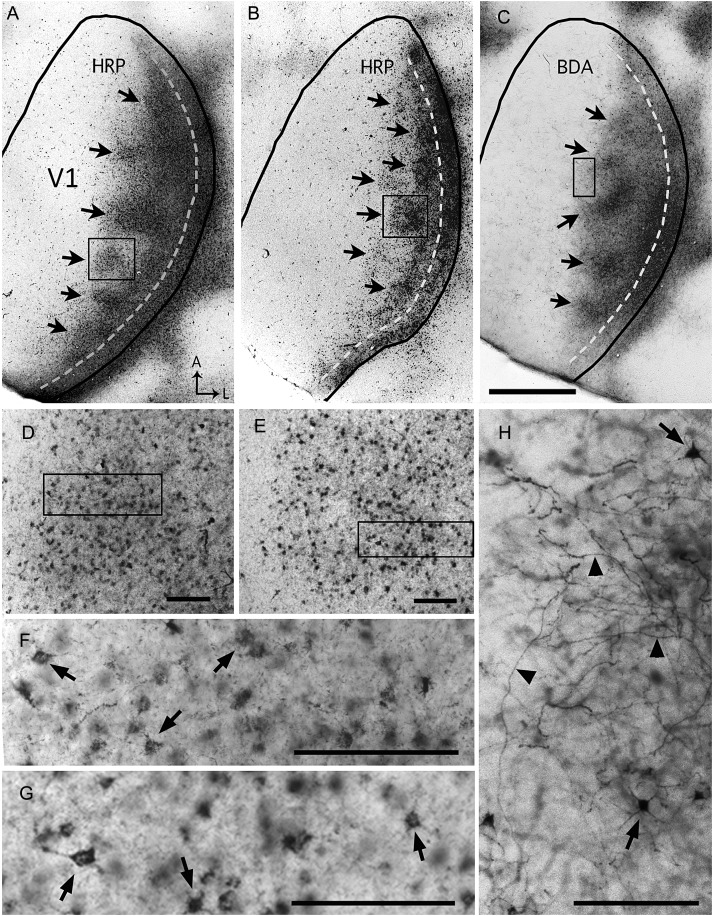
Figure 3.
Patchy callosal connections demonstrated in tangential sections through the right V1 following multiple intracortical injections of HRP (A,B) or BDA (C) into the left hemisphere. The black lines indicate the border of V1. Dark areas in lateral V1 correspond to dense accumulations of transported tracer. This labeled callosal region consists of a series of patches located medially (arrows in A–C) and a densely labeled band adjacent to the lateral border of V1 (dashed lines in A–C). Panels D and E are higher-magnification views of the callosal patches within the boxes in A and B, respectively, and the boxes in D and E are shown at higher magnification in F and G, respectively. Higher-magnification views of HRP-labeled regions show primarily retrogradely labeled somas (dark dots in D and E) and finer labeling likely contained in axons and dendrites (Trojanowski et al. 1981). Arrows in F and G indicate retrogradely HRP-labeled somas. Panel H is a high-magnification view of the BDA-labeling within the box in C, and it illustrates that BDA (10 kDa) primarily labels fibers (black arrowheads) that likely transported BDA anterogradely, and occasionally somas and dendrites (arrows) (Reiner et al. 2000). A: anterior, L: lateral. Scale bar in C = 1.0 mm; in D–H = 100 μm.

