Figure 5.
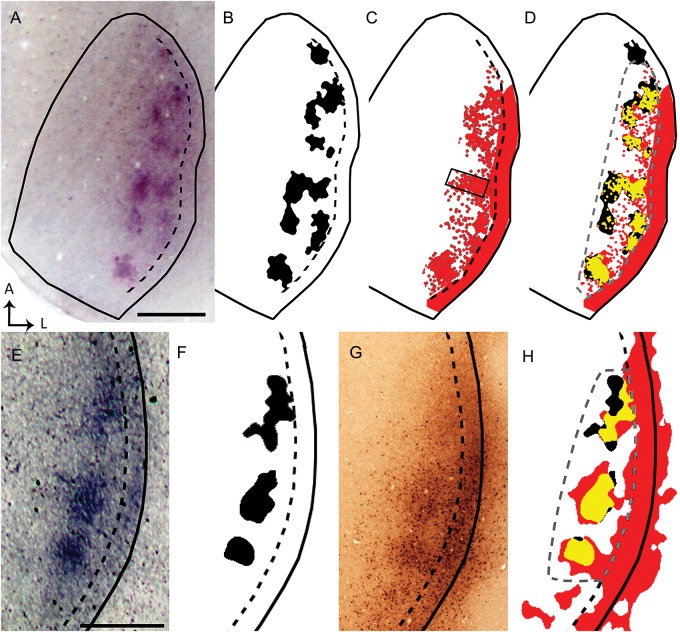
Data from 2 rats (A–D and E–H) illustrate that ipsilateral eye domains correlate with callosal patches in the same animal. Solid black lines indicate the border of V1. Dashed black lines indicate estimated border between the CS and LS. WGA-HRP-labeled ipsilateral eye domains (A,E; thresholded version shown in black in B and F, respectively) were correlated in the same animal with callosal connections demonstrated with RB (red areas in C) or with BDA (G, thresholded version colored red in H). High-magnification images captured under epifluorescence of the callosal patch within the box in C show RB-labeled cells bodies (see Supplementary Fig. 2B), illustrating that this tracer is transported retrogradely (Katz et al. 1984). In D and H, the patterns of callosal connections are shown superimposed to the patterns of ipsilateral eye domains from the same animal, and the overlapping regions are colored yellow. Statistical analysis of the correlation was performed in the area outlined by the dashed gray line in D and H (χ2, P < 0.01). Scale bars = 1.0 mm.

