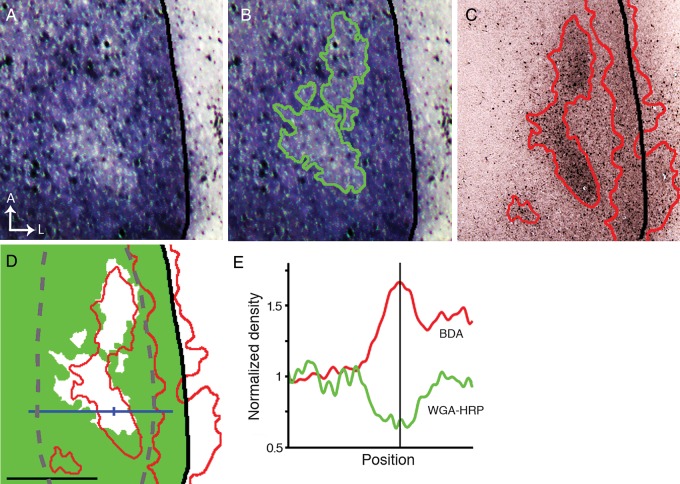
Figure 6.
Areas of reduced contralateral eye input in V1 correlate with callosal patches. (A) Areas of reduced WGA-HRP labeling in the hemisphere contralateral to the eye injected with WGA-HRP. (B) The green line outlining these areas was determined by thresholding the labeling pattern in A. (C) Pattern of callosal connections in the same animal demonstrated by multiple intracortical injections of BDA in the opposite hemisphere. Densely labeled callosal regions are outlined by red lines determined by thresholding the image. (D) The outline of the callosal pattern (red line) is shown superimposed to a thresholded version of the WGA-labeling pattern in B, in which densely labeled areas are colored green while the areas of reduced WGA-labeling appear white. Note that only callosal patches in the CS correlate with areas of reduced WGA-HRP labeling. Statistical analysis of the correlation was performed in the area outlined by the dashed gray line (χ2, P < 0.01). The area occupied by the densely labeled band of callosal connections at the LS receives strong input from the contralateral eye. (E) Plots of the labeling density at the level indicated by the blue line in D show that the increase in the density of BDA callosal labeling (red curve) corresponds precisely with a reduction of input from the contralateral eye (green curve). The vertical line in E corresponds to the tick mark on the blue line in D. Scale bar = 1.0 mm.

