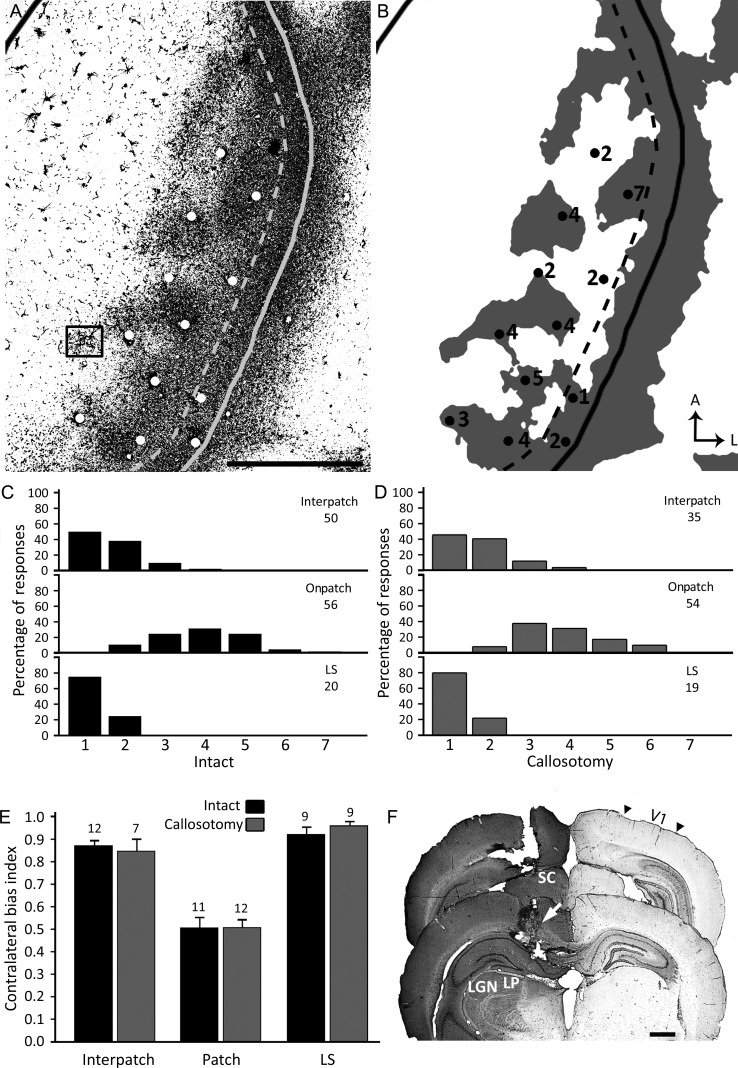
Figure 9.
Electrophysiological mapping of ocular dominance preference in intact and callosotomized rats. (A) Pattern of callosal connections in the right V1 demonstrated after multiple injections of HRP into the opposite hemisphere in an intact rat. HRP-labeled cells in the region indicated by the box are shown at higher magnification in Supplementary Figure 2A. Speckles in medial regions of V1 represent reaction artifact. (B) Thresholded version of the callosal pattern. The dashed line in A and B indicates the approximate border between the CS and the LS, while the solid line indicates the border of V1. Dots in A and B indicate electrophysiological recording sites in the same animal. In B, the Hubel and Wiesel rating for ocular preference is indicated by the number next to the penetrations. (C,D) Recording sites were classified into 3 groups depending on whether they fell on a patch or interpatch regions of the CS, or within the LS. The histograms represent the percent of sites assigned to each of the 7 Hubel and Wiesel ocular dominance classes in each of these regions in intact (C) and callosotomized rats (D). The number of sites recorded in each region is indicated. (E) Comparison of contralateral bias indices (mean ± SEM) for the interpatch, patch, and LS regions in intact and callosotomized rats (see Results for statistical analysis). The number of rats analyzed in each group is indicated. (F) Effectiveness of the callosotomy procedure. The sections shown were taken 6.0 mm (back panel) and 4.2 mm (front panel) from bregma. White arrow shows transection of the corpus callosum. Black arrowheads indicate borders of V1. LGN = lateral geniculate nucleus, LP = lateral posterior nucleus. Scale bars = 1.0 mm.

