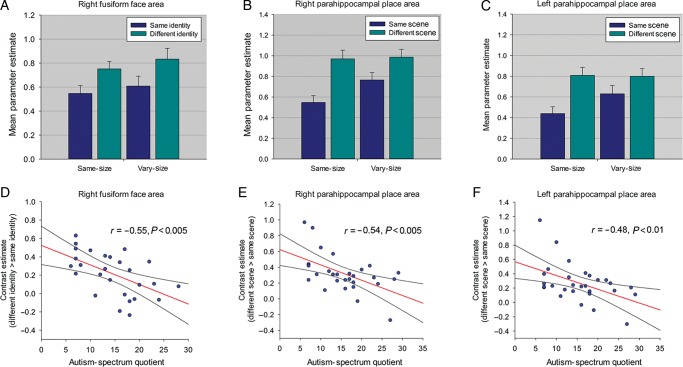
Figure 3.
(A) Parameter estimates (+1 SD) for same- and different-identity conditions in right FFA in Experiment 2. (B) Parameter estimates (+1 SD) for all same- and different-scene conditions in right PPA and (C) left PPA in Experiment 3. (D) Relationship between AQ and RS in right FFA in Experiment 2. (E) Relationship between AQ and RS in right PPA and (F) left PPA in Experiment 3. All scatter plots show contrast estimates of RS (across Image Size) plotted against individual measures of AQ. Regression line and 95% confidence intervals are shown.

