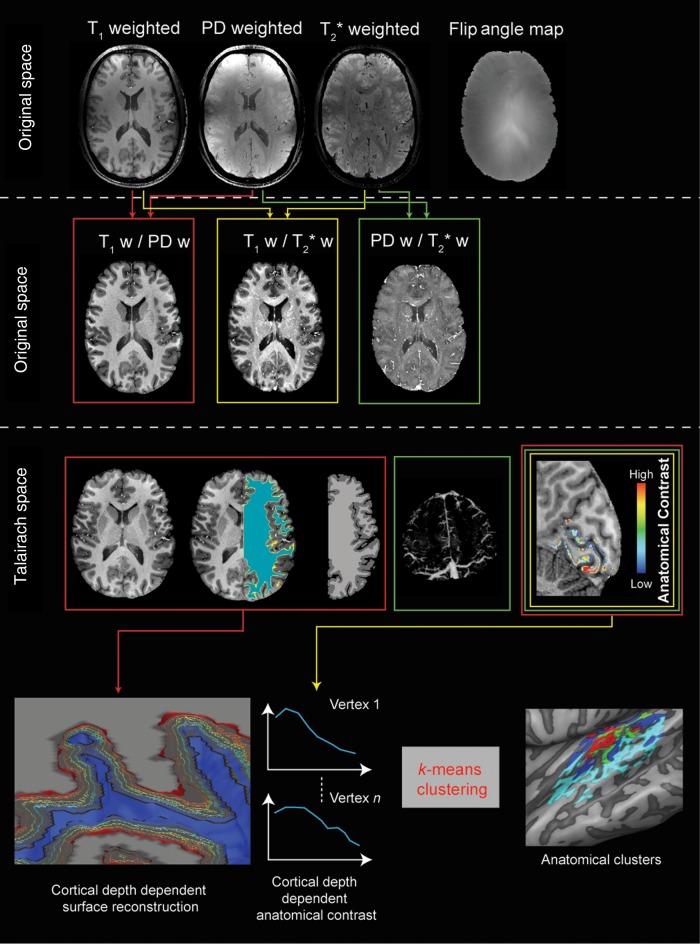
Figure 1.
The analysis pipeline for anatomical images. Individual subject data resampled at 0.3 mm isotropic (top row) are combined to obtain 3 different ratio images resampled at 0.5 mm isotropic and corrected for residual inhomogeneities to obtain unbiased anatomical images (second row). The T1w/PD ratio images are segmented to obtain the white/gray matter border and gray matter mask for each individual subject. The T2*w/PDw images are used to obtain individual subject venograms. The gray matter mask, the venograms, and the T1w/T2*w images are used to obtain individual subject intracortical maps related to myelin content (middle row). Advanced segmentation and cortical thickness measures are used to define cortical depth-dependent surfaces. After sampling the anatomical contrast at the different relative cortical depths, this information is submitted to a clustering algorithm in order to obtain a parcellation (bottom row).

