
Figure 2.
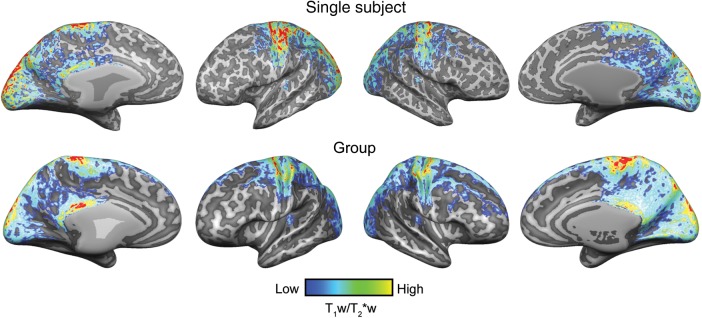
Single-subject (S6) and group (N = 6) (after cortex-based alignment) intracortical (myelin-related) maps. Anatomical contrast is projected on the individual reconstructed surfaces of both hemispheres (top row) and on the average (after cortex-based alignment) cortical surfaces (bottom row).