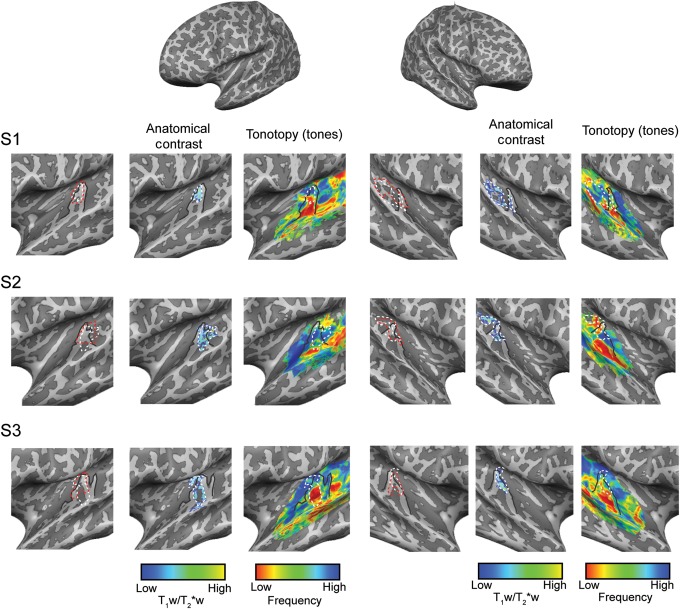
Figure 3.
Single-subject (S1, S2, and S3) intracortical (myelin related) and tonotopic maps as obtained in experiment 1 (“tones”). Anatomical contrast and tonotopic maps are projected on the individual reconstructed surfaces of both hemispheres. Macroanatomical features (HG) and the highly myelinated region in the auditory cortex are outlined on all maps (solid black and dotted white line, respectively). The cluster resulting in the highest myelin-related content throughout the cortical depth is outlined in red.

