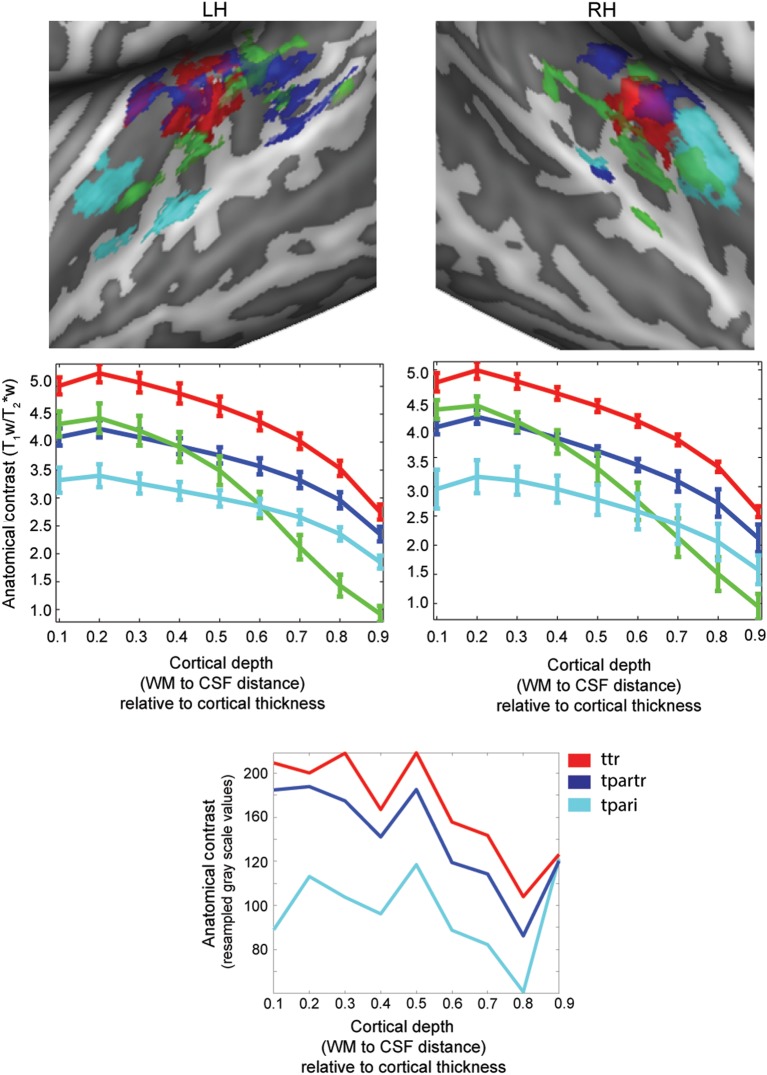
Figure 5.
Cortex-based realigned group clusters (top) as identified by the parcellation procedure (k-means clustering). Individual maps are thresholded in order to show only vertices consistently assigned to the same cluster in at least 4 of the 6 subjects. Cortical depth-dependent profiles (middle) of anatomical contrast related to the centroid of each cluster (standard error computed across subjects) are reported together with the anatomical maps and color-coded accordingly. The bottom panel represents the cortical depth profiles for the regions ttr, tpartr, and tpari as digitized from Nieuwenhuys (2013).

