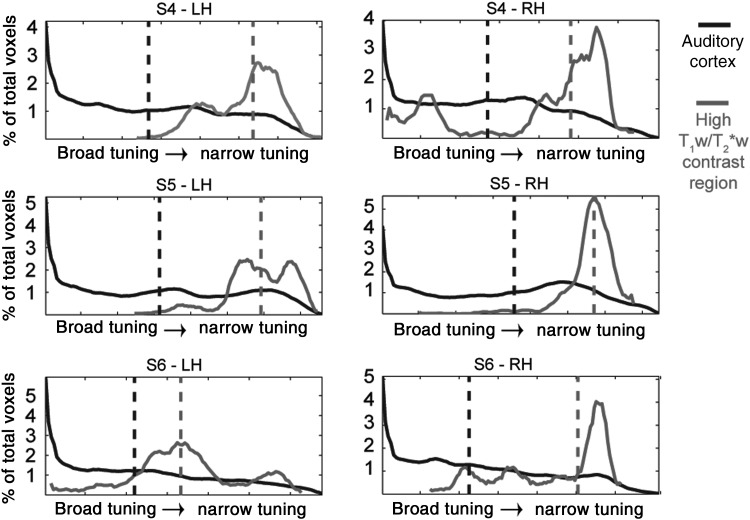
Figure 6.
Distribution of tuning width values within the auditory cortex (black line) and the region with the highest T1w/T2*w signal (gray line) for each individual subject and hemisphere. Vertical dotted lines represent the median of the distribution. The shift of tuning width toward narrow values (high values of tuning width) can be noted in each individual hemisphere.

