Figure 1.
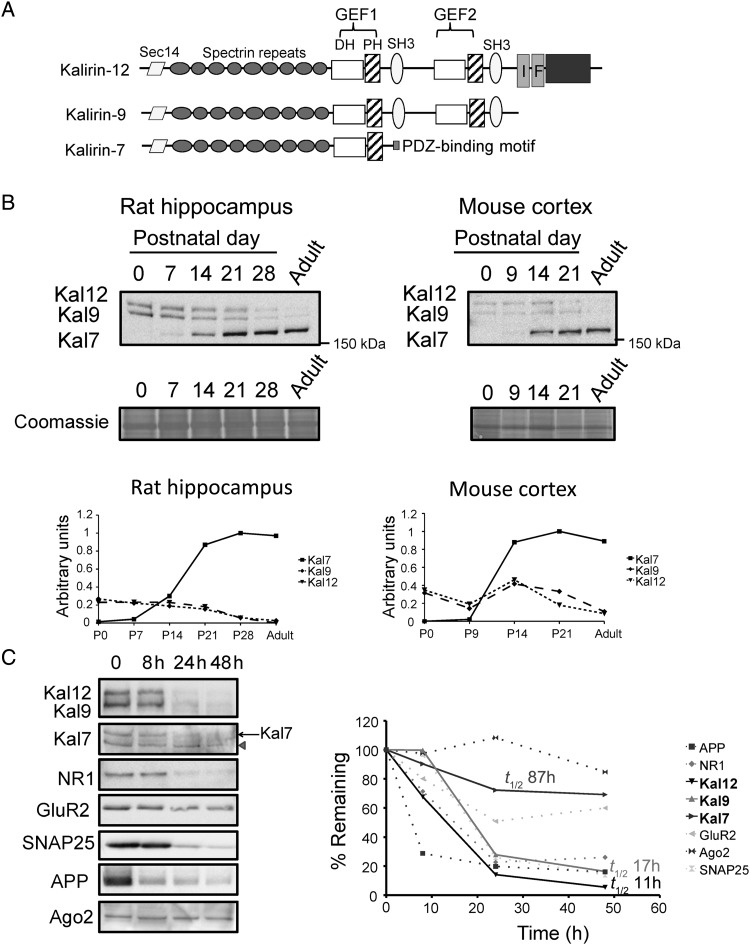
Developmental expression of Kalirin isoforms. (A) Diagram showing the major isoforms of Kalirin. (B) Rat hippocampi and mouse cortices were collected at the indicated ages; equal amounts of protein were subjected to western blot analysis and representative blots are shown. Affinity-purified Sec14 antibody was used to visualize all Kalirin isoforms. Below: quantification of Kal7, Kal9, and Kal12 after normalization to βIII tubulin; the maximum expression level was set to 1.0 for each data set; 3 sets of tissue were analyzed to generate both graphs. (C) Protein half-life was determined using cycloheximide (10 μM) to treat identical rat cortical cultures (DIV21) for the times indicated; lysates were subjected to western blot analysis. Loss of Kalirin was compared with loss of proteins known to turn over rapidly [APP (Morales-Corraliza et al. 2009), NR1 (Huh and Wenthold 1999)] or slowly [GluR2 (Huh and Wenthold 1999) and Ago2 (Adams et al. 2009)]. Ago2 turnover is rapid in cancer cells, but slow in neuronal cultures. Kal9 and Kal12 were detected using antibody CT301; Kal7 was detected using antibody JH2959. Arrowhead, known nonspecific band in Kal7 blot. Right: quantification of western blot signal as a function of time; half-lives for Kal7, Kal9, and Kal12 were calculated using semi-log plots. In parallel experiments using [35S]Met to monitor protein synthesis in culture, 10 μM cycloheximide blocked 95% of protein synthesis, as expected (Sobota et al. 2009; not shown). This experiment was replicated 3 times with similar results.

