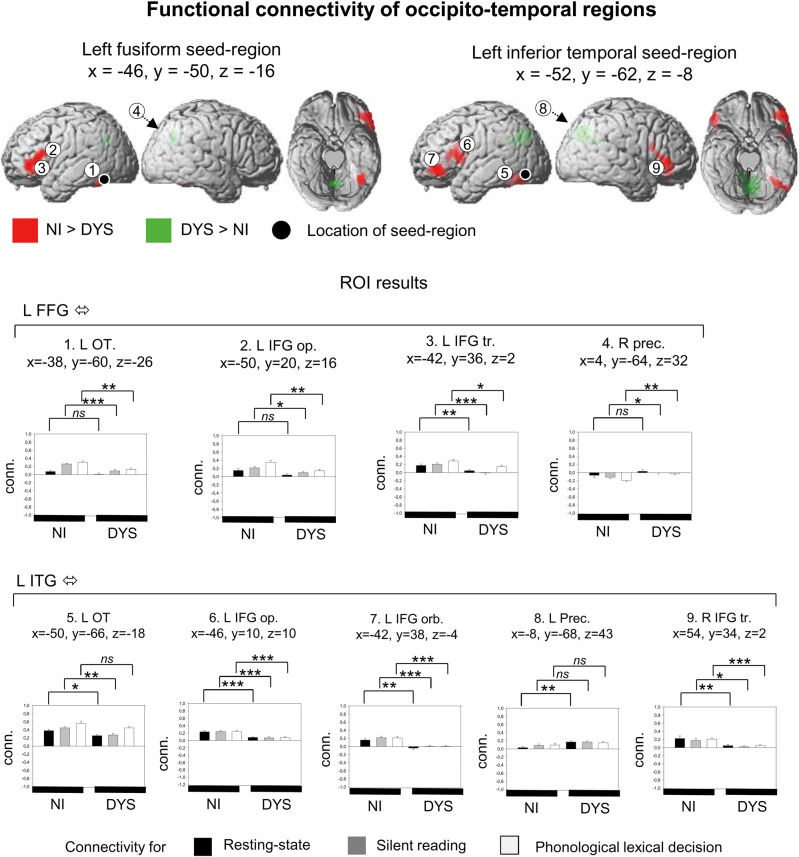
Figure 2.
Functional connectivity for seed regions in the left fusiform gyrus and the left inferior temporal gyrus. Group differences are shown in terms of main effects, stronger activation for nonimpaired readers is shown in red, stronger activation for dyslexic readers is shown in green. Maps are shown at a voxel-wise threshold of P < 0.001 uncorrected and a cluster extent threshold of P < 0.05 FWE-corrected. Brain connectivity estimates are shown for regions of interest. Connectivity values correspond to standardized correlation coefficients. *P < 0.05,**P < 0.01.

