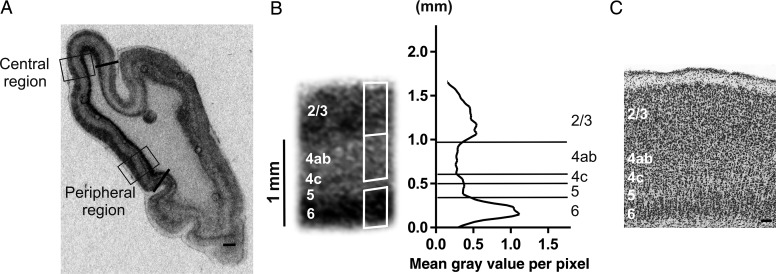
Figure 1.
Illustration of the quantitative analysis of the zif268 in situ hybridization results for cat area 17. (A) Coronal brain section at Horsley–Clarke level posterior 6 (P6, Rosenquist 1985). Areal borders of area 17 are marked by black lines, boxes indicate the regions of interest: the central (C) and peripheral (P) visual field representation in area 17, which are placed within the binocular zone (up to 10° and 15–20°, respectively). (B) Example image of the zif268 mRNA signal from the central visual field representation accompanied by a line graph in which the mean gray value per pixel is plotted in function of cortical depth. Cortical layers (indicated on the left) are based on Nissl counterstaining. White rectangles demarcate lamina-specific zif268 OD quantification regions. Cortical layers are separated by horizontal lines, the Y-axis represents the distance from the underlying white matter in millimeter. (C) Nissl staining of the central region of area 17 with cortical layers 2/3, 4, 5, and 6 enumerated, scale bars (100 μm).

