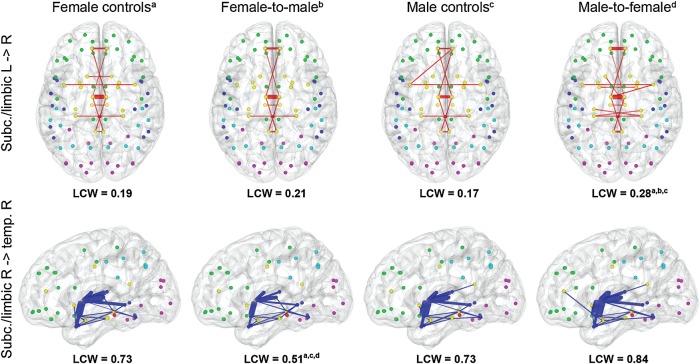
Figure 1.
Average structural connectivity for female controls, female-to-male transsexuals, male controls, and male-to-female transsexuals for full (i.e., unthresholded connectivity matrices). Increased LCW was found in male-to-female transsexualsa,b,c between right subcortical (subc.)/limbic and left subcortical/limbic lobes (red, top). Decreased LCW was found in female-to-male transsexualsa,c,d between right subcortical/limbic and right temporal (temp.) lobes. Line thickness indicates connectivity weighting, whereas only connections with weights of >0.001 are shown (arbitrary choice to remove spurious connections as probabilistic tractography represents the robustness of the modeled tracts against noise). Nodes represent region of interest centers for frontal (green), temporal (blue), parietal (cyan), occipital (magenta), and limbic/subcortical brain regions (yellow). Characters indicate significant differences as compared with female controls (a), female-to-male transsexuals (b), male controls (c), or male-to-female transsexuals (d), see Table 1 for details. Axial images are in radiological view (i.e., left image side is right hemisphere).

