Figure 1.
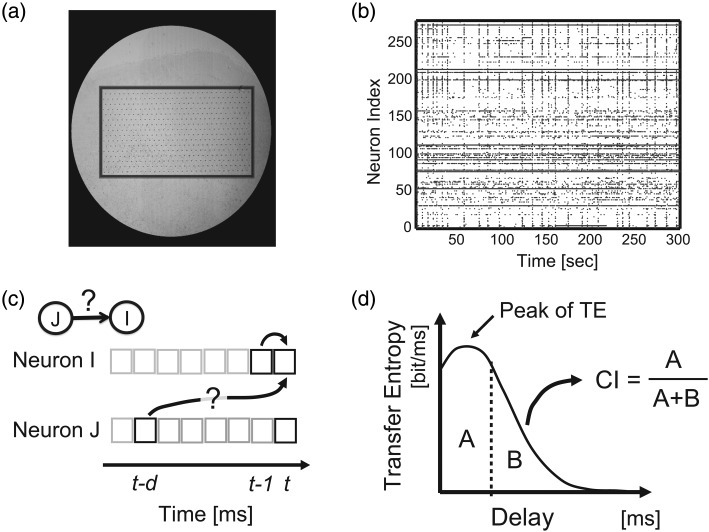
Experimental setup. (a) Micrograph of cortical slice culture on a 512-electrode array. Array is ∼1 × 2 mm, outlined for visibility. Small dots are electrodes, arranged hexagonally with 60 μm spacing. (b) Representative raster of activity. Dots represent spikes from 260 sorted neurons, shown for 300 s. (c) Schematic of transfer entropy (TE) showing 2 binned spike trains. TE evaluates how much neuron J's past spiking activity improves the prediction of neuron I's activity beyond the prediction based on neuron I's activity from the previous time bin. Here, delay indicates time lag chosen for the spiking activity of neuron J. (d) Definition of the Coincidence index (CI). When TE was plotted as a function of delay, CI was the ratio of area under the peak (A) to total area under the curve (A + B).

