
Figure 2.
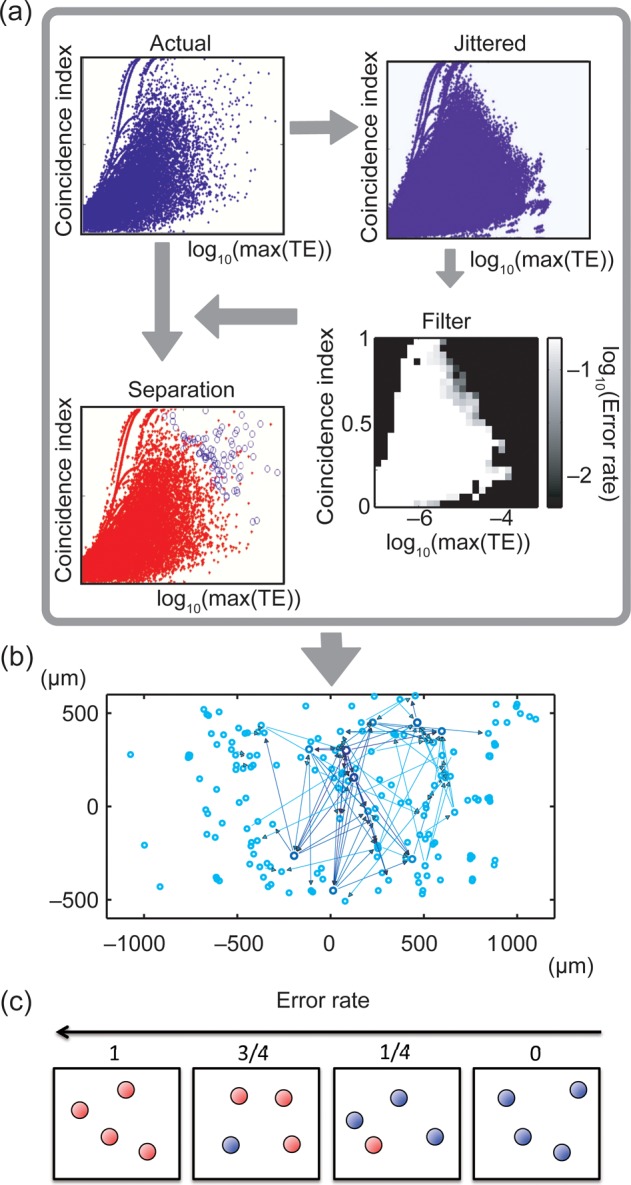
Approach for determining significant connections. (a) First, CI was plotted against log(TEmax) for all neuron pairs from actual data (dots represent pairs). Second, CI was plotted against log(TEmax) for jittered data. Third, both plots were combined to construct a filter that indicated the ratio of jittered dots to all dots in each of the 25 × 25 2D bins (white: many jittered; black: few jittered). Fourth, filter was used to indicate actual connections where jittered pairs were few. Several lines in the distributions occur because when coincident firing happens only once or twice, the TE values become disretized. (b) Connectivity map with actual directional connections plotted as arrows. Thickness indicates strength. Circles represent presumed neuron locations on array. (c) The concept of error rate. The red and blue balls, respectively, represent data samples of jittered data (n = 100) and original data included in a bin. Because error rate is defined as ratio of the number of red balls to the number of all balls, the error rate becomes higher toward the left side in this figure.