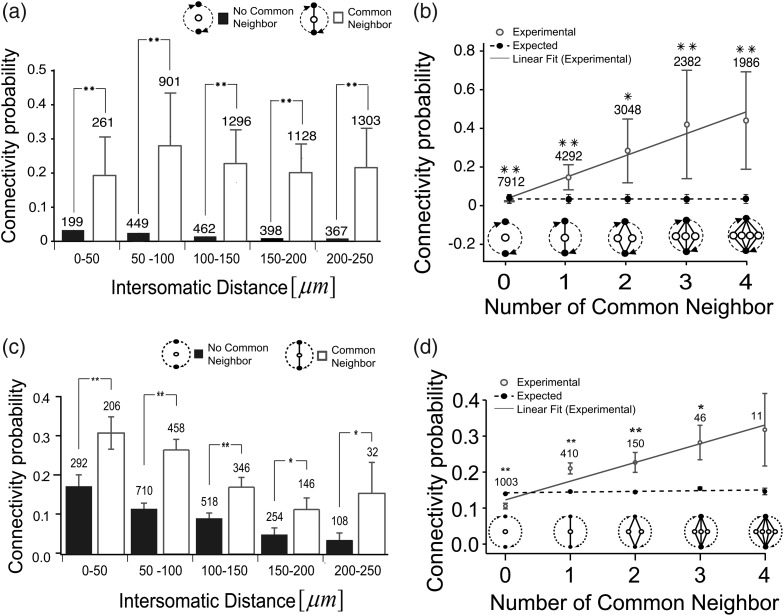
Figure 5.
Common neighbors increase probability of further connections. (a) Probability of an effective connection (from TE) as a function of distance for pairs that share a common neighbor (filled bars) and those that do not (open bars). Error bars are SEMs of 10 data samples (*P < 0.01, t-test). (b) Probability of an effective connection (from TE) between 2 neurons as a function of different numbers of common neighbors. Solid line is the best fit line from data. Dotted line is best fit line for chance expected values. The expected values were given how many common neighbors will be observed just when given the connectivity probability of the real data. Error bars are SEMs of 9 data samples. For comparison, (c) and (d) show same analyses applied to synaptic connectivity assessed by patch-clamp (Perin et al. 2011).

