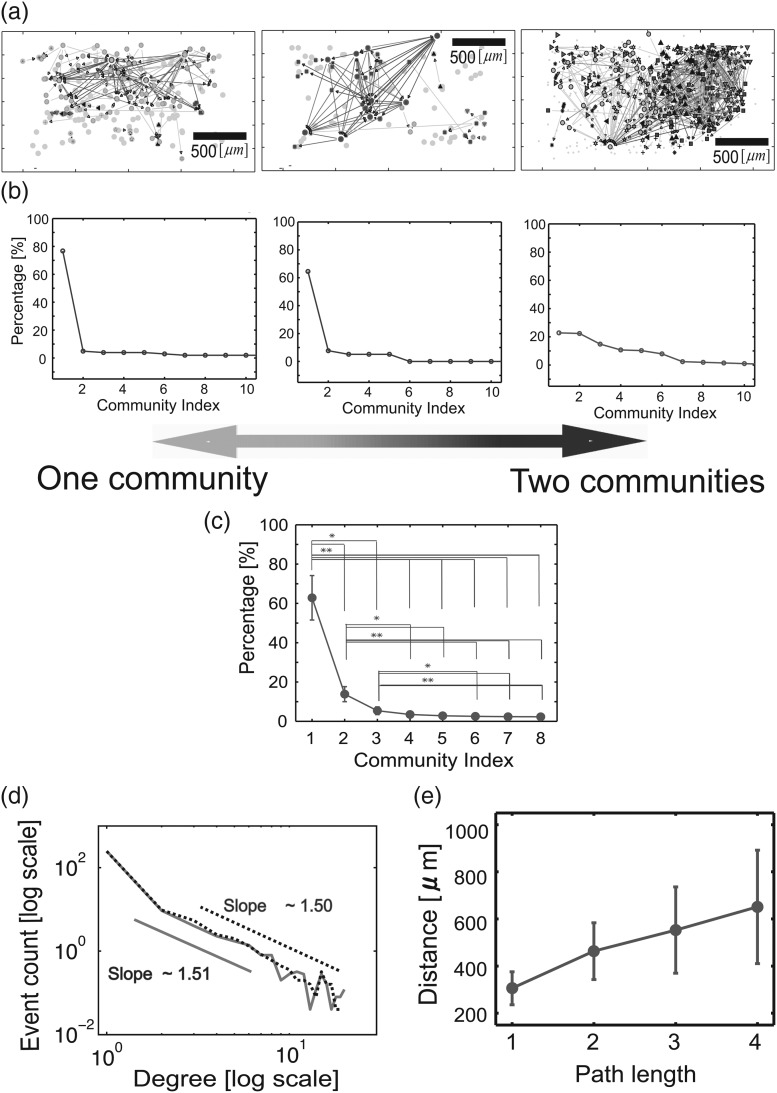
Figure 6.
Large-scale structure of networks. (a) Spatial locations of neurons recorded from the rectangular electrode array, with effective connections shown. The 3 networks represent the breadth of community structures found. These 3 networks are shown at figure 7(e) and (f) with colored and zoomed. (b) Percentage of neurons included in communities plotted against number of communities, for the 3 networks. (c) Average percentage of neurons included in communities plotted against number of communities. Note that, on average, only 2 communities were needed to encompass over 95% of neurons (*P < 0.01, **P < 0.001). (d) Distribution of neuron degrees, plotted in log–log space. The dotted line is for out-degree, the solid line is for in-degree. Note fat tail of distribution, different from chance expectation. (e) Distance between neurons plotted against path length. Path length tended to increase with distance linearly. The error bars are standard deviation among slices.

