
Figure 4.
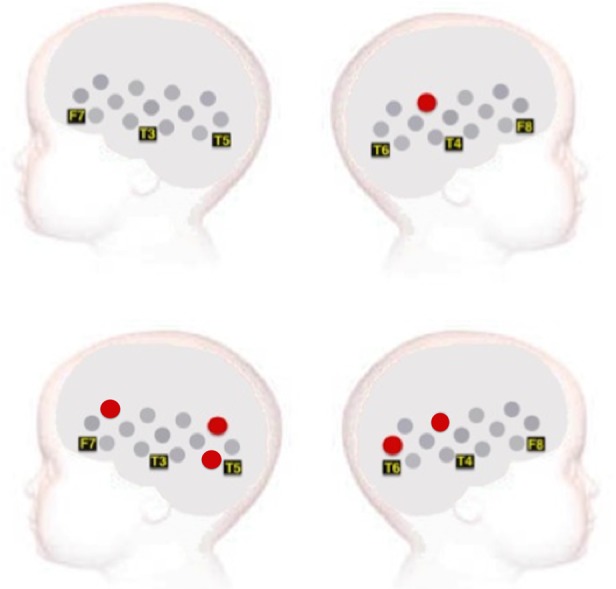
A schematic view of the sensor pads with channels showing a significant increased HbO2 activation during the contingent condition compared with the non-contingent condition and selected locations from the 10–20 arrays in Experiment 1 (top panel) and Experiment 2 (bottom panel). No channels show a hemodynamic change in the non-contingent condition compared with the contingent condition.