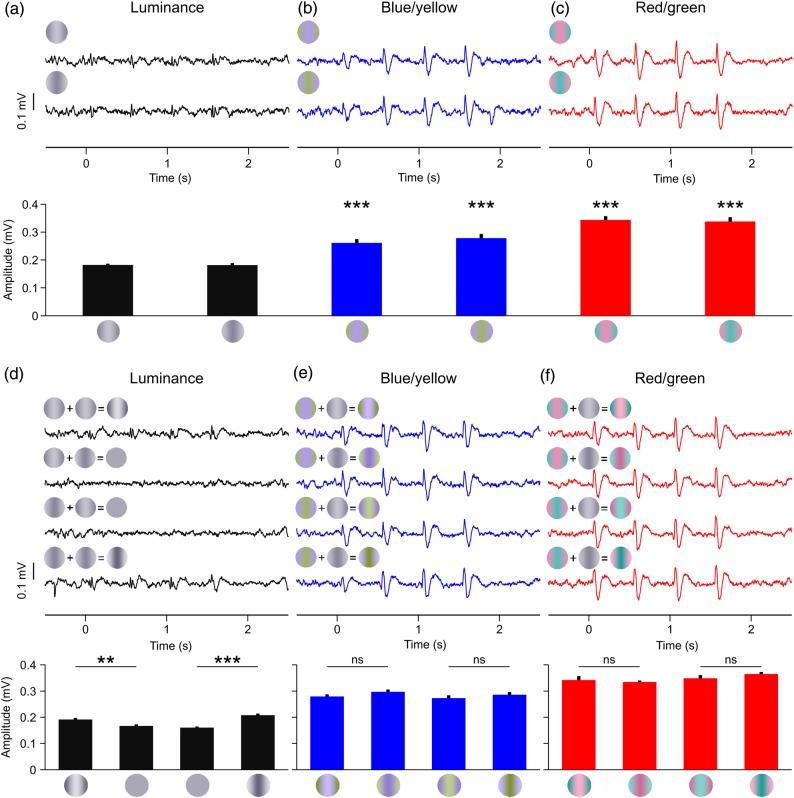
Figure 2.
LFP chromatic responses for the contrast test (a–c) and the phase test (d–f). LFP traces (top) and mean LFP amplitude (bottom) for the 3 cardinal axis: luminance (a,d), blue/yellow (b,e), and red/green (c,f). The gratings at the top left corner of the LFP trace illustrate the stimulus phase (a–c) or the phase combination used to construct the stimulus (d–f). See Materials and Methods for details. t-Test: ***P < 0.001, **P < 0.01, *P < 0.05, ns = not significant, n = 8 trials.

