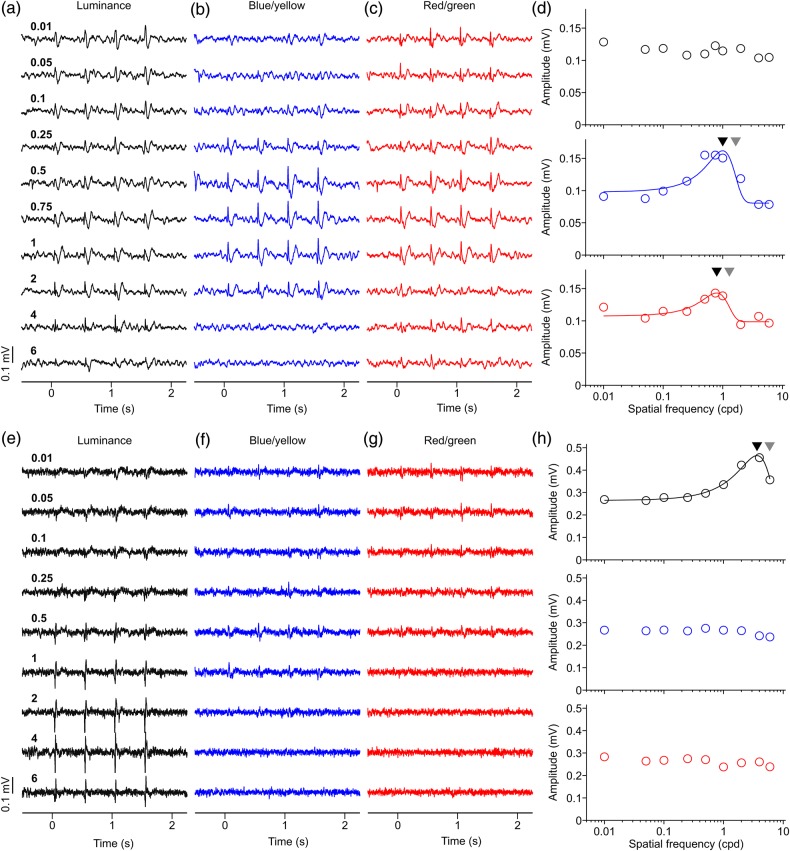
Figure 4.
Two more examples of LFP spatial frequency tuning. (a–d) LFP recording with band-pass spatial frequency tuning for red/green and blue/yellow gratings. The tuning for luminance grating could not be fitted because we did not use gratings with spatial frequency high enough to reach the cutoff value. LFP chromatic response could be confirmed with the phase test for red/green gratings but not blue/yellow gratings. Maximum axis contrast was 30% for luminance and 94% for blue/yellow and red/green. Black triangles: spatial frequency peaks. Gray triangles: spatial frequency cutoffs. Visual eccentricity 8.73° (azimuth: 7.76°, elevation: 4°). (e–h) LFP recordings with band-pass spatial frequency tuning for the luminance axis, and no spatial frequency tuning for the chromatic axes. LFP responses to blue/yellow and red/green could not be confirmed as chromatic with either contrast or phase tests. Maximum axis contrast was 94% for luminance, for blue/yellow and red/green. Visual eccentricity 15.31° eccentricity (azimuth: 15.29°, elevation: 0.71°).

