
Figure 1.
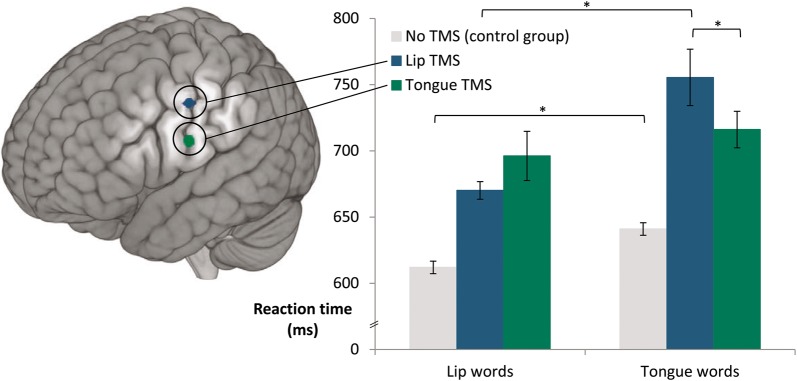
(Left) average stimulation locations for lip and tongue representation shown on a standard MNI brain (lip x, y, z = −55.4, −9.2, 43.9; tongue x, y, z = −59.4, −7.4, 22.8). (Right) significant interaction of word type by TMS location (reaction time data). The label ‘Lip words’ denotes words starting with bilabial lip-related phonemes, whereas ‘Tongue words’ denotes words starting with alveolar tongue-related phonemes. Error bars show ±1 SEM after removing between-subject variance (Morey 2008) *P < 0.05.