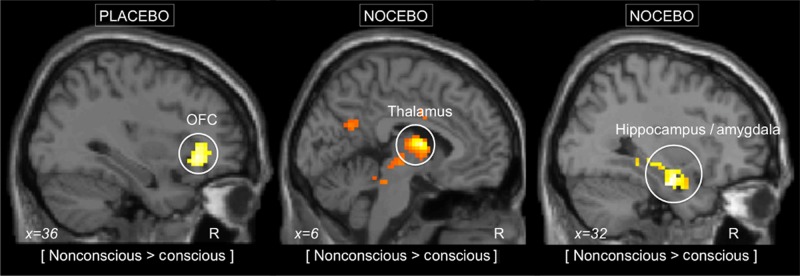
Figure 3.

Neural correlates to nonconscious placebo and nocebo responses. Left panel: the nonconscious placebo condition, compared with conscious placebo, was associated with increased activity in the OFC, as illustrated by the circle. Middle and right panel: the nonconscious nocebo condition, compared with conscious nocebo, was associated with increased activity in the amygdala, hippocampus, and thalamus. The initial statistical threshold was P < 0.01, family-wise corrected for ROI.
