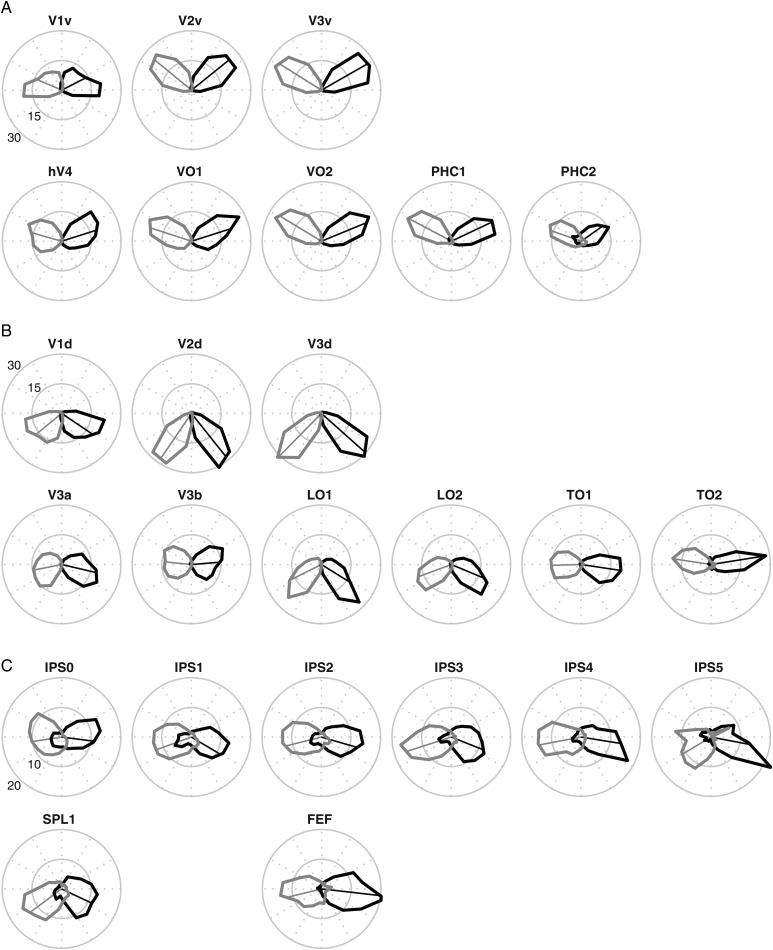
Figure 12.
Visual field coverage for all ROIs in the SBA MPM. Polar angle histograms of the visual field coverage of the MPM projected onto novel subjects using the leave-one-out SBA. Polar angle phase values were extracted from data obtained using the retinotopy (A and B) or memory-guided saccade task (C) and concatenated across all subjects. Thick lines show the visual field coverage for the left (black) and right (gray) hemispheres as a proportion of the total coverage of an ROI. The thin-lined vectors represent the mean phase for a given ROI. As expected, all MPM ROIs projected to regions with a clear contralateral bias.

