
Figure 2.
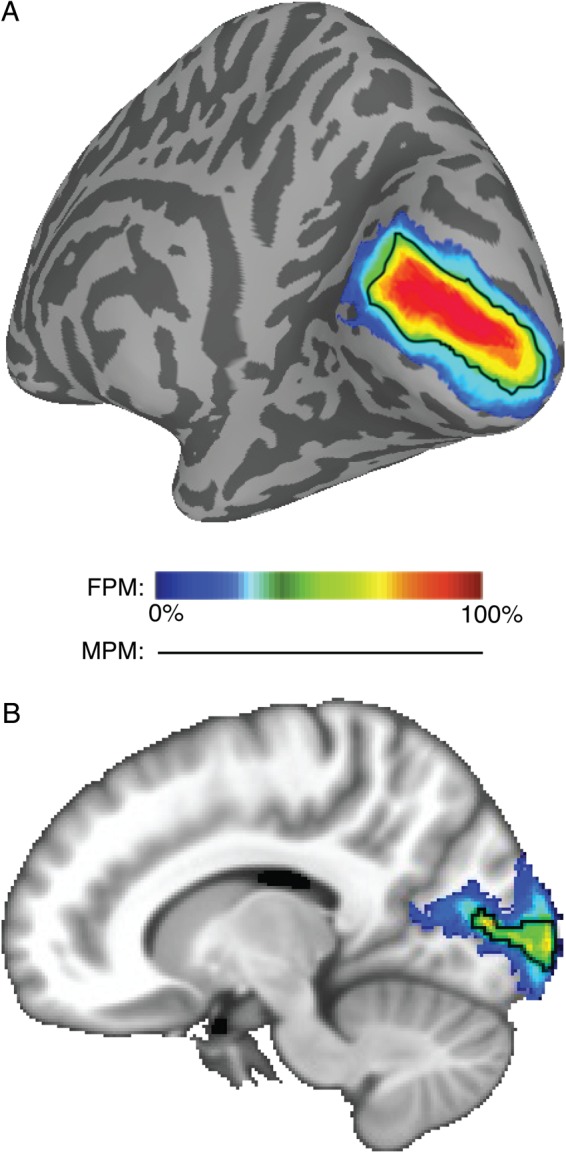
An exemplary FPM of the right hemisphere V1d. The color-coded nodes in the SBA (A) and voxels in the VBA (B) denote the probability of that node or voxel being assigned to the right V1d across subjects (n = 50). The probability gradually increases from blue to red indicated by the color scale. In both panels, higher probabilities are located more centrally within the full distribution accounting for the majority of the variance in anatomical location across subjects (see central tendency measure for more details). For comparison, the black line denotes the border of the MPM for V1d, which is a function of the FPMs for all ROIs (see Fig. 3).