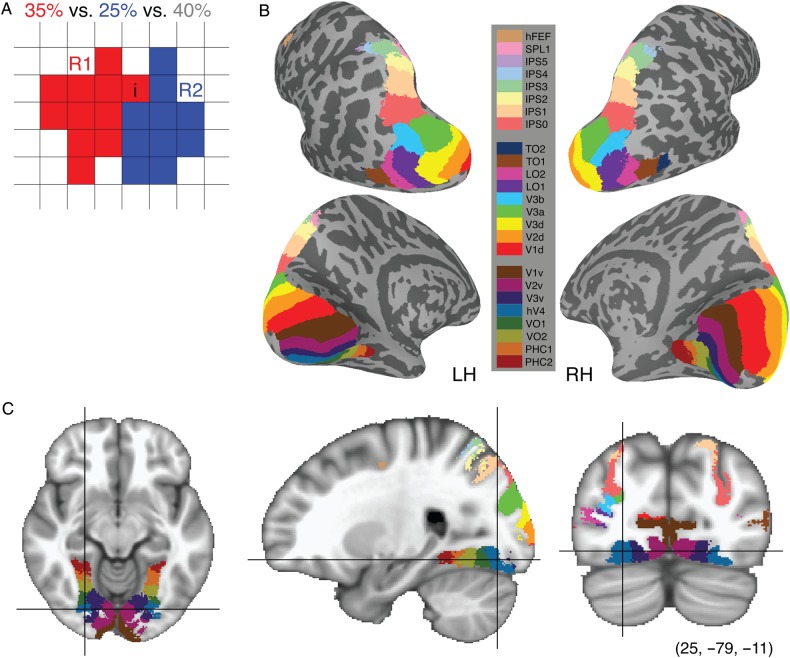
Figure 3.
MPM of visual topography. (A) Schematic presentation of the algorithm for generating the MPM. For the ith element, the probability of being assigned to region R1 (red), region R2 (blue) and outside visual topography (white) is 35, 25 and 40%, respectively. First, we combined the probability arranged in visual topographic areas together and compared with the outside one. Then choosing the maximum probability over all candidates within visual topography takes the ith element to be assigned to region R1. MPMs are displayed in both surface (B) and volume (C) space. Each color-coded area denotes a specific visual ROI. The surface MPM (B) shows the same overall structure as seen in individual subjects (see Fig. 1). The color map is the same for both surface and volume space.

