Figure 6.

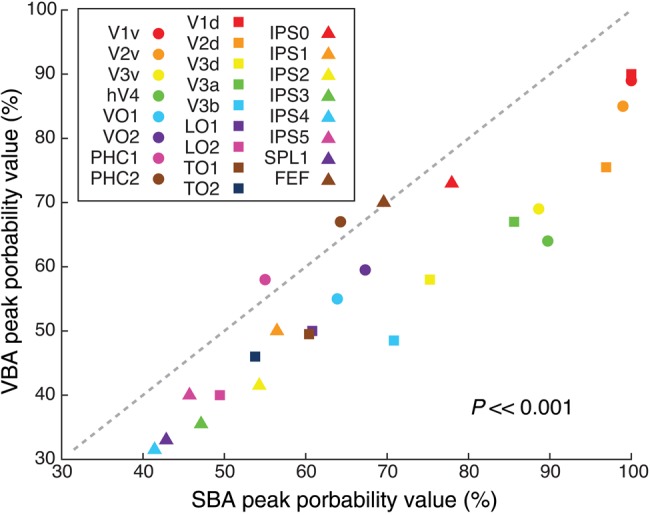
Peak probability values for the FPM. The peak probability value was calculated for each ROI in both the SBA and VBA. In general, this value was higher in SBA than VBA across all ROIs (P << 0.001, paired t-test).

Peak probability values for the FPM. The peak probability value was calculated for each ROI in both the SBA and VBA. In general, this value was higher in SBA than VBA across all ROIs (P << 0.001, paired t-test).