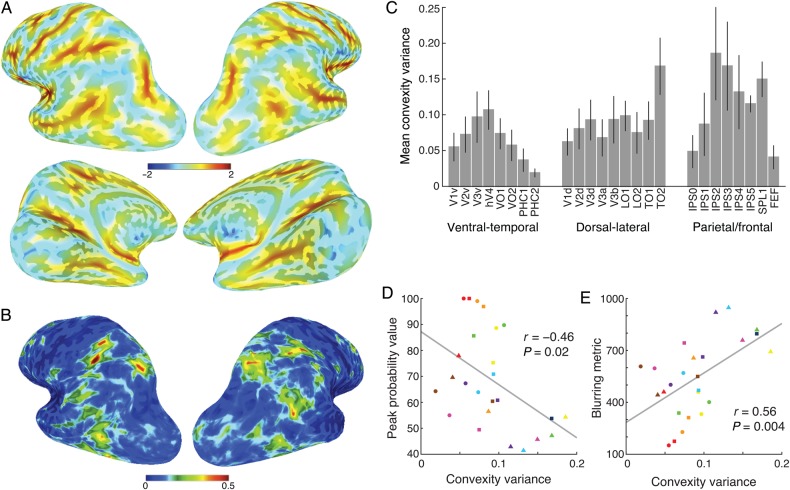
Figure 9.
The effect of anatomical variance on the surface-based probabilistic atlas. Anatomical variance was quantified by sulci and gyri convexity. The nodal-based mean (A) and variance (B) of the convexity are shown on brain surfaces for visualization purposes. The ROI-based mean variance and standard error of the convexity for each ROI averaged across both hemispheres in MPM across the subjects is also shown (C). Significant correlations between mean convexity variance and peak probability value (D) and blurring metric (E) were observed across the ROIs. Marker conventions for individual ROIs are as in Figure 5.

