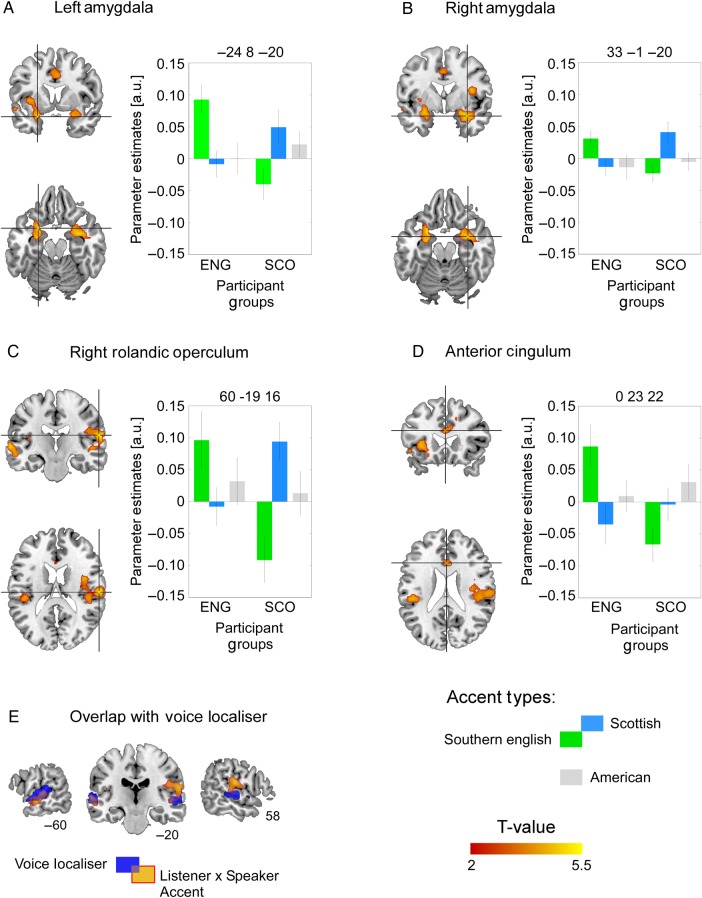
Figure 2.
Overlay of significant interaction between participant group (Scottish, Southern English) and accent type of the speakers (Scottish, Southern English) in (A) left amygdala, (B) right amygdala, (C) right rolandic operculum, and (D) anterior cingulum. Bar graphs represent the parameter estimates in the peak voxels of each significant cluster and clearly indicate the interaction between the accent type of the speakers (green: Southern English; blue: Scottish; gray: American for completion) and the accent of the listeners. Error bars represent standard error of the mean. (E) Significant interaction between participant group (listeners) and accent type (speakers) overlaid on voice-sensitive areas of cortex (dark blue).

