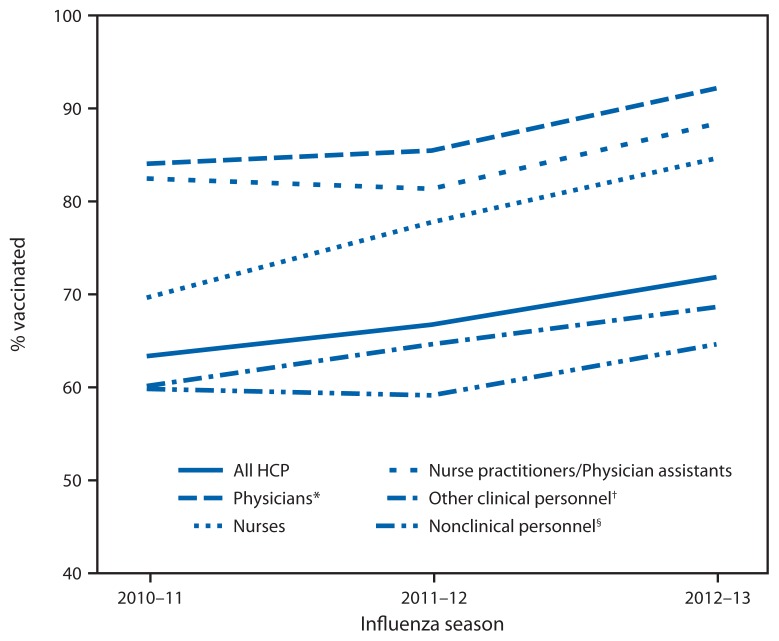
FIGURE 1.
Percentage of health-care personnel (HCP) who received influenza vaccination, by occupation type — Internet panel survey, United States, 2010–11, 2011–12, and 2012–13 influenza seasons
* Included dentists in 2010–11 season.
† All seasons include pharmacists, allied health professionals, technicians, technologists, assistants, or aides. Dentists were added starting from the 2011–12 season.
§ Administrative support staff or manager, and nonclinical support staff (e.g., food service workers, housekeeping staff, maintenance staff, janitors and laundry workers).

