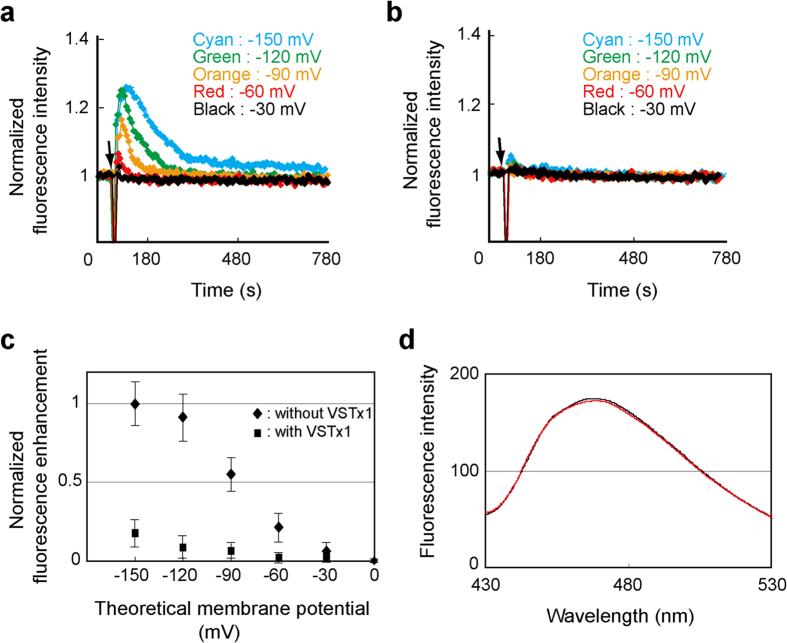
Figure 1. Voltage-dependent conformational change of VSD and its inhibition by VSTx1.
(a) Relative fluorescence intensities of mBBr-labeled VSD reconstituted into liposomes in the absence of VSTx1. Valinomycin was added at the time point indicated by an arrow to form the membrane potentials as indicated. (b) Relative fluorescence intensity of mBBr-labeled VSD in the presence of 0.5 mM VSTx1. (c) The mean values of transient increases in the fluorescence plotted against the membrane potentials. Plots are normalized by the value at the theoretical membrane potential −150 mV without VSTx1. Error bars represent SD (n = 5). (d) Fluorescence spectra of mBBr-labeled VSD in the absence (black) and presence (red) of VSTx1.

