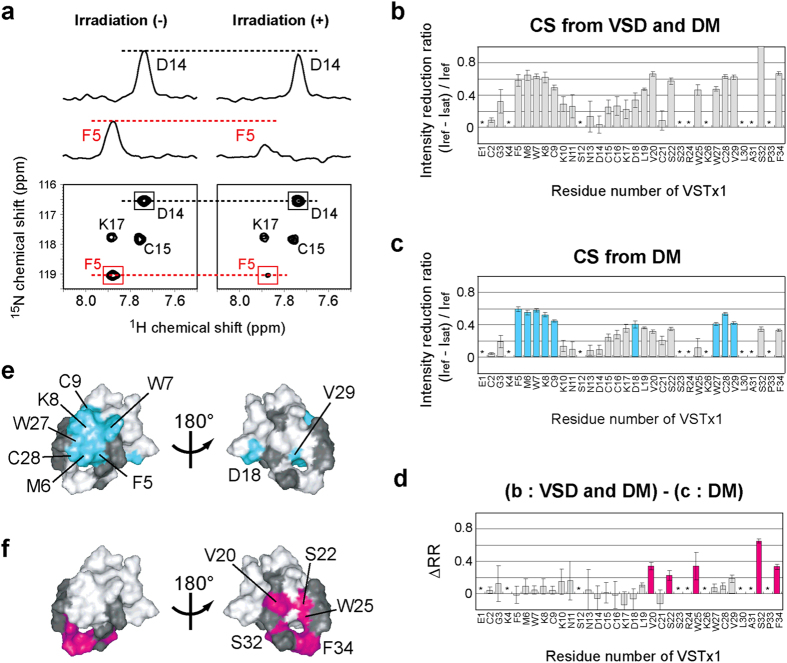
Figure 4. Cross saturation (CS) experiments to identify the binding sites of DM and VSD on VSTx1.
(a) A selected potion of the 1H-15N TROSY spectra of uniformly 2H, 15N-labeled VSTx1 in complex with unlabeled VSD recorded without (left) and with (right) irradiation of the radio frequency (R.F.) pulses. Cross-sections are also shown for the signals from Phe 5 and Asp 14. (b) CS experiment using unlabeled VSD, where CS from DM and VSD was simultaneously observed. The ratios of the signal intensities with and without irradiation were plotted against the residue numbers of VSTx1. The residues indicated by asterisks are those with the signal-to-noise ratios less than 10. The error bars were calculated based on the signal-to-noise ratios in (b–d). (c) CS experiment using uniformly 2H-labeled VSD, where CS only from DM was observed. Bars for the residues with significant intensity reductions (minimum values of intensity reduction ratios >0.35) are colored cyan. (d) Plots of the difference in the intensity reduction ratios (ΔRR) in the presence of unlabeled and uniformly 2H-labeled VSD. Bars for the residues with significant intensity reductions (minimum values of ΔRR > 0.15) are colored magenta. (e,f) Mapping of the affected residues in (c,d) on the VSTx1 structure (PDB code 1S6X). The residues with no data are colored black.

