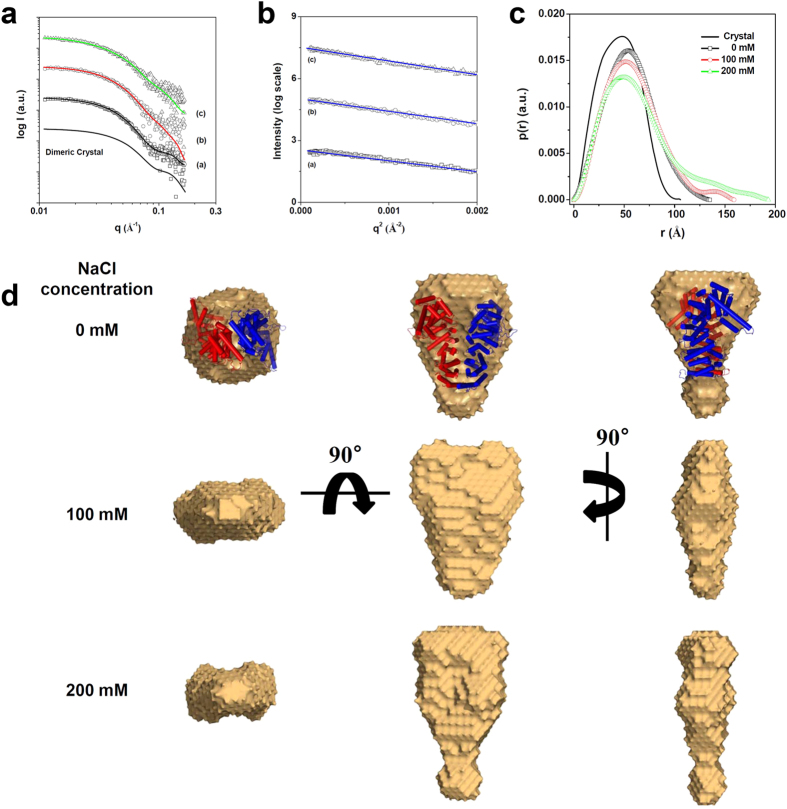
Figure 1. SAXS measurement of CTNNBL1.
(a) X-ray scattering profiles of CTNNBL1 proteins in various concentrations of NaCl. The open symbols are the experimental data, and the solid lines are the X-ray scattering profiles obtained from the dummy atom models with the lowest χ = 1.560–1.640 values by the program DAMMIF. The solid line without symbols is the theoretical SAXS curve calculated from the crystal structure of CTNNBL1. a, b, and c indicate the X-ray scattering profiles of CTNNBL1 in 0, 100, and 200 mM NaCl, respectively. For clarity, each plot is shifted along the log I(q) axis. (b) Guinier plots of the X-ray scattering profiles of CTNNBL1 proteins. The straight lines were obtained from the linear regression of the scattering data in the q2 region. a, b, and c indicate the X-ray scattering profiles of CTNNBL1 in 0, 100, and 200 mM NaCl, respectively. For clarity, each plot is shifted along the ln I(q) axis. (c) Pair distance distribution functions p(r) for CTNNBL1 protein. The p(r) functions of CTNNBL1 in solutions with various concentrations of NaCl were calculated using the program GNOM. The NaCl concentrations used are indicated. (d) Reconstructed structural models of CTNNBL1 protein. For each reconstruction, five independent models were generated, compared, and averaged (Mean values of NSD of reconstructed models =0.493–0.650). The filtered model was calculated using the program DAMAVER.

