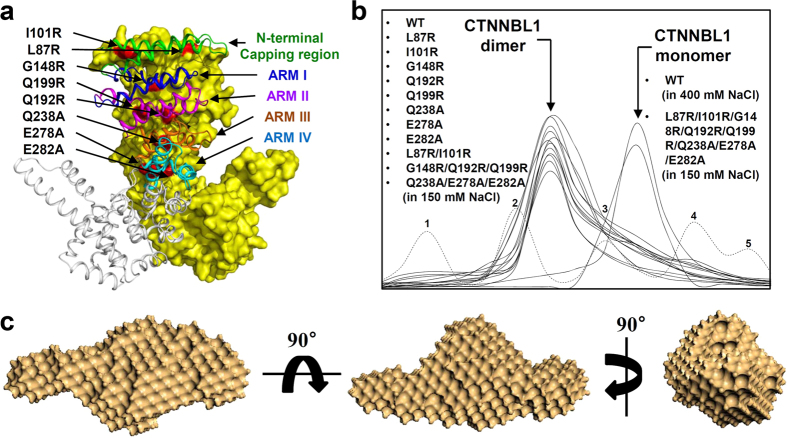
Figure 2. Dimerization of CTNNBL1.
(a) Interface of CTNNBL1 dimerization. The CTNNBL1 dimer is shown. One monomer is shown as a surface model in yellow, and the residues modified by site-directed mutagenesis are shown in red and labeled appropriately. The other monomer is shown as a cartoon diagram. The N-terminal capping region, ARM I, ARM II, ARM III, and ARM IV are shown in green, blue, magenta, orange, and cyan, respectively, and labeled appropriately. (b) Size-exclusion chromatography of the CTNNBL1 mutants. The elution peaks corresponding to the dimeric or monomeric form of CTNNBL1 are indicated by arrows. The CTNNBL1 mutants L87R, I101R, G148R, Q192R, Q199R, Q238R, E278A, E282A, L87R/I101R, G148R/Q192R/Q199R, and Q238A/E278A/E282A eluted as dimers at 150 mM NaCl, with molecular weights of ~110 kDa. The elution peak was compared with that of wild-type CTNNBL1 at 150 mM NaCl. The CTNNBL1 eight-point mutant (L87R/I101R/G148R/Q192R/Q199R/Q238A/E278A/E282A) eluted as a monomer at 150 mM NaCl, with a molecular weight of ~55 kDa. The elution peak was compared with that of wild-type CTNNBL1 at 400 mM mM NaCl. For a precise analysis of molecular weight, standard samples of ferritin (440 kDa), aldolase (158 kDa), conalbumin (75 kDa), ovalbumin (44 kDa), and carbonic anhydrase (29 kDa) were used for calibration in size-exclusion chromatography experiments; the peaks are labeled from 1 to 5, respectively. (c) Reconstructed structural model of CTNNBL1 mutant. For the reconstruction, five independent models were generated, compared, and averaged (Mean values of NSD of reconstructed models = 0.493–0.650). The filtered model was calculated using the program DAMAVER.

