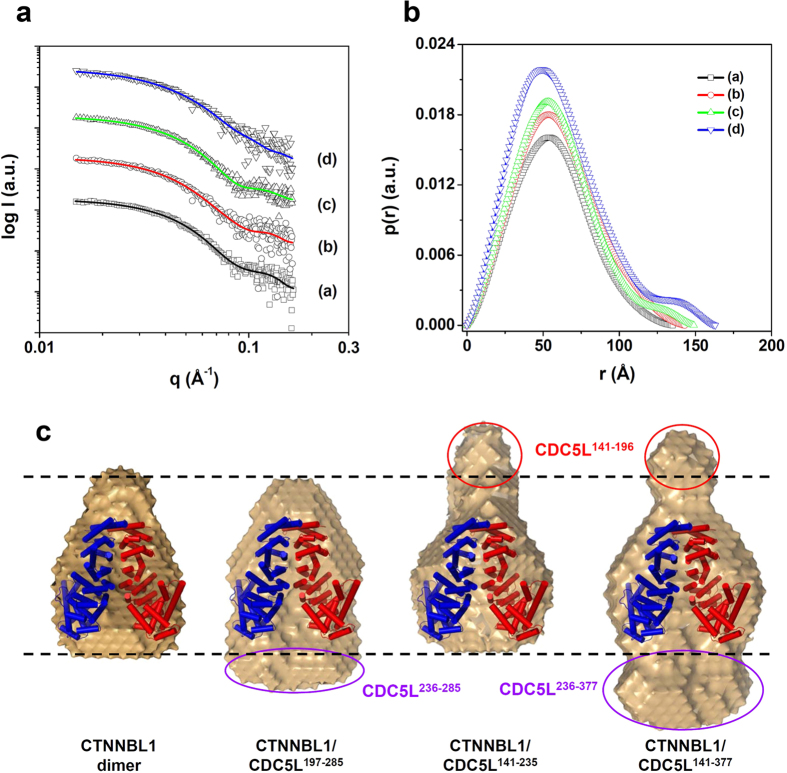
Figure 4. SAXS analysis of the CTNNBL1/CDC5L complexes.
(a) X-ray scattering profiles of the CDC5L/CTNNBL1 complexes. The open symbols are the experimental data, and the solid lines are the X-ray scattering profiles obtained from the dummy atom models with the lowest χ = 1.560–1.680 values by the program DAMMIF. a–d are CTNNBL1 alone, CTNNBL1/CDC5L197–285, CTNNBL1/CDC5L141–235, and CTNNBL1/CDC5L141–377, respectively. For clarity, each plot is shifted along the log I(q) axis. (b) Pair distance distribution functions p(r) for CTNNBL1/CDC5L complexes calculated using experimental SAXS. The areas under the curves were normalized to the molecular weight. a–d are as described in (a). (c) Reconstructed structural models of the CTNNBL1/CDC5L complexes. For each reconstruction, five independent models were generated, compared, and averaged (Mean values of NSD of reconstructed models = 0.552–0.671). The filtered model was calculated using the program DAMAVER. For comparison of overall shapes and dimensions, the ribbon diagram of the atomic crystal models were superimposed onto the reconstructed dummy atoms models using the program SUPCOMB. (NSD = 4.423 for CTNNBL1 alone, 5.046 for CTNNBL1/CDC5L197–285, 5.070 for CTNNBL1/CDC5L141–235, 6.196 for CTNNBL1/CDC5L141–377) The CDC5L141–196 region located at the top of the N-terminal capping region of CTNNBL1 is indicated with a red circle and labeled. The CDC5L236–285 and CDC5L236–377 regions located at the bottom of ARM VII of CTNNBL1 are indicated with purple circles and labeled.

