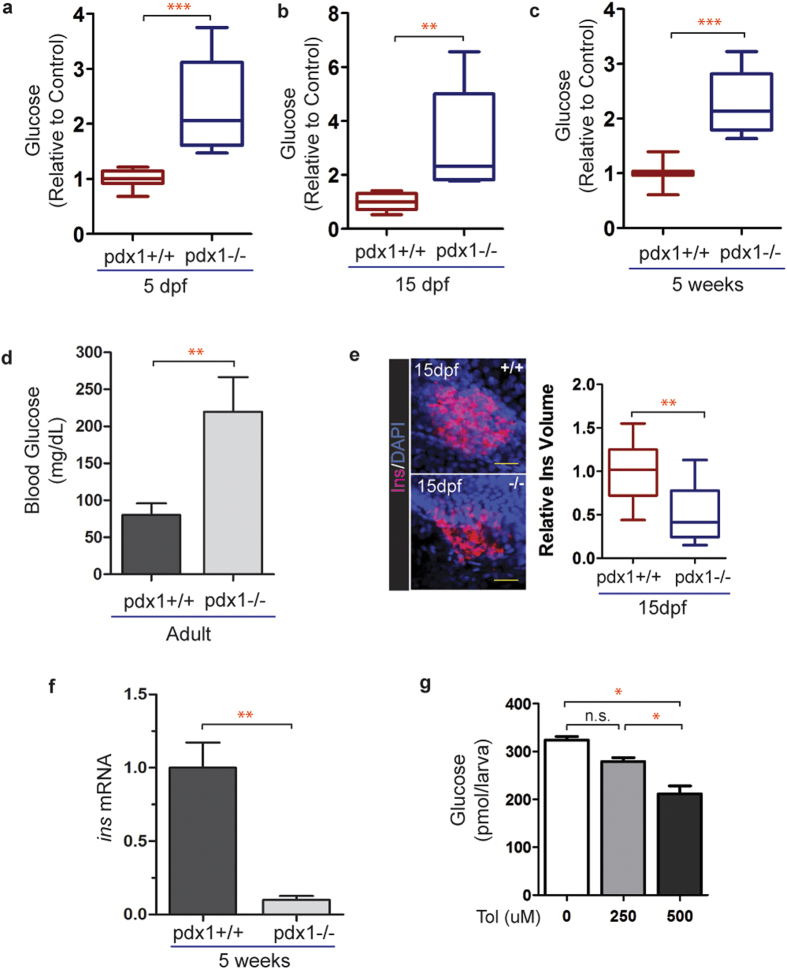
Figure 4. Glucose homeostasis is disrupted in pdx1 mutants.
(a) Quantitation of glucose levels from 5 dpf whole larval extracts (pools of 10 embryos). n = 4 biological replicates, results combined from 3 independent experiments (***p < 0.0001, t-test). (b) Glucose levels measured at 15 dpf in extracts from pools of 3 fish, normalized to the average control value. n = 4 biological replicates, results are combined from 3 independent experiments (**p < 0.01, t-test). (c) Glucose levels relative to control from 5-week single fish (wild type, n = 7; mutant, n = 10, ***p < 0.0001, t-test). In box plots, line shows the median, box extends from the 25th to the 75th percentile, whiskers indicate 10th and 90th percentiles. (d) Adult blood glucose levels. Values are mean ± SEM. (pdx1+/+, n = 13; pdx1−/−, n = 9; **p < 0.01; t-test.) (e) Pancreas of wild type and mutant zebrafish at 15 dpf, immunostained with insulin (Ins) antibody, nuclei are counterstained with DAPI (left). Scale bar, 20μm. Quantitation of the volume of insulin staining (right). Results combined from 2 independent experiments. (pdx1+/+, n = 15; pdx1−/−, n = 16) **p < 0.001 (t-test). (f) Relative insulin mRNA levels as determined by qPCR in 5-week old wild type and pdx1−/− mutant fish. **p < 0.01 (t-test) (g) Treatment of pdx1 mutants at 5 dpf with 500 uM tolbutamide for 2 hours lowered glucose levels by 36%. *p < 0.05 (one-way ANOVA, Tukey’s Multiple Comparison Test). Results shown are representative of 2 independent experiments.

