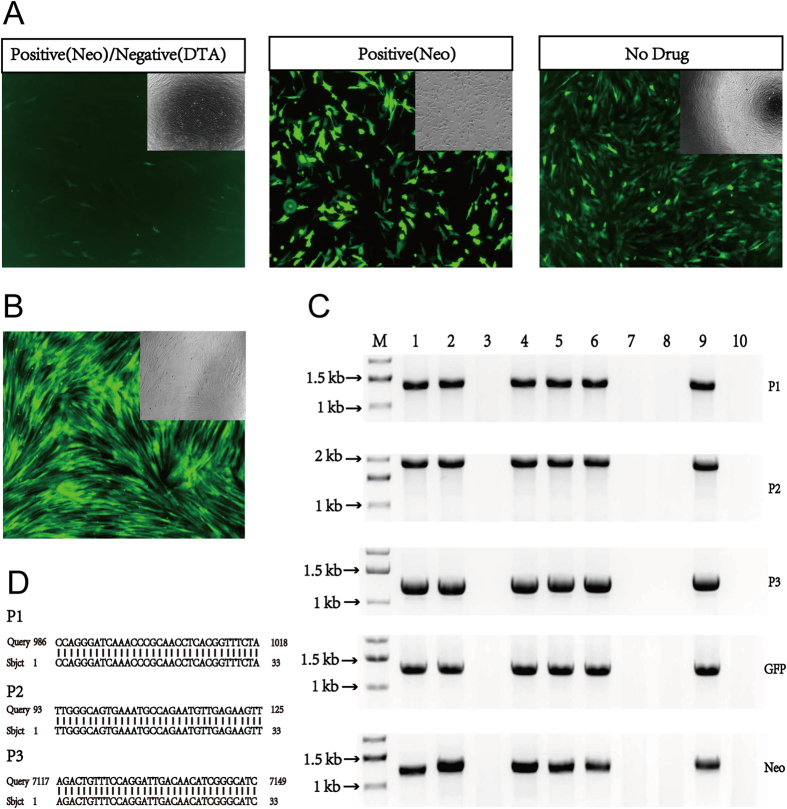
Figure 3. Generation of pig PFF cell lines with site-specific GFP integration.
(A) Transfected PFF cells 3 days after positive/negative drug selection (left image), positive drug selection (middle image) and no drug selection (right image). The insets show bright-field images. GFP was not detected until after day 8 in positive/negative drug selected cells (data not shown). (B) Examples of positive GFP cell clones after clone expansion. The inset shows bright-field image. (C) Representative genomic PCR results for screening positive clones. M: DNA marker, # 1, # 2, # 4, # 5, # 6 and # 9 are positive clones and # 3, # 7, # 8 and # 10 are negative clones. P1 and P2 amplified the 5’- junction, whereas P3 amplified the 3’- junction (see Fig. 1B for primer locations). Full-length gels are presented in Supplementary Figure S4. The gels have been run under the same experimental conditions. (D) Representative Blast results comparing PCR fragment sequences with genomic junction sequences. See a full Blast comparison in Supplementary Information. Note: Both bright field images and fluorescence images were in 40 × magnification.

