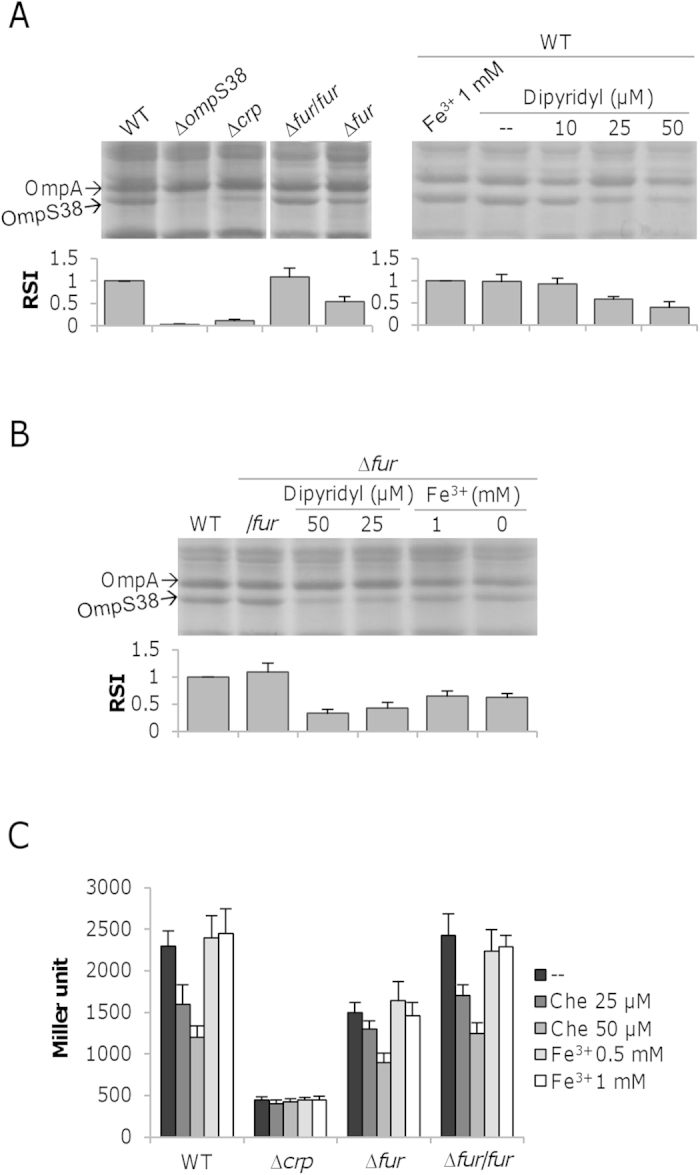
Figure 7. Fur is involved in regulation of ompS38.

(A) SDS-PAGE analysis of OM proteins in strains indicated. The assay included the wild-type strain with iron at different levels, which were achieved by adding FeCl3 or iron-chelator dipyridyl. The lanes shown here were from the same gel, which was given in Fig. S3B. (B) SDS-PAGE analysis of OM proteins in the ∆fur strain under conditions indicated. In both (A,B), relative signal intensity (RSI) of OmpS38 in the indicated samples was estimated using software Image J. The averaged value for the wild-type in each gel was set to 1 as the standard, to which values of other samples were normalized. The values are the mean ± SD (error bars) (n = 4). (C) Expression analysis of PompS38 in strains under conditions indicated. Che represents chelator dipyridyl. Experiments were conducted independently at least three times and error bars represent S.D. or the representative was presented.
